
- Start >
- Rivers >
- Waterlevel >
- Regnitz >
- Lauf >
- Chart of year

Chart of year Lauf / Pegnitz
Waterlevel from 01.01.2015 to 31.12.2015
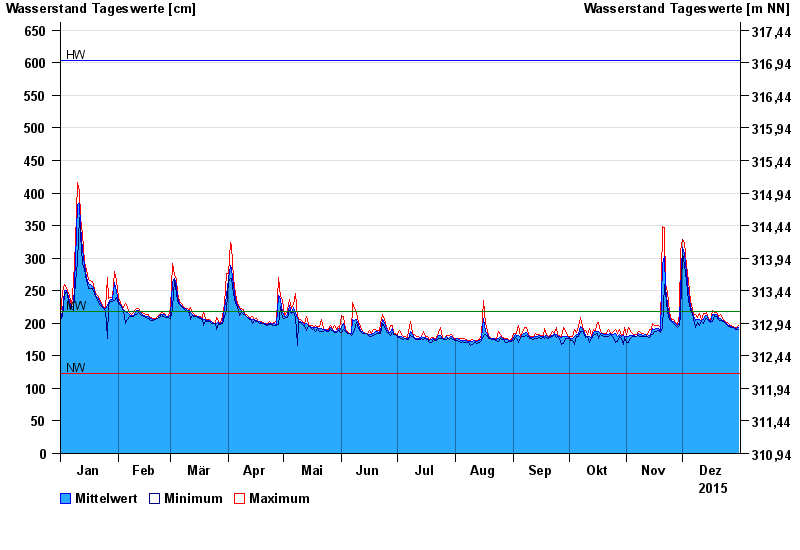
| Date | Mean value [cm] | Maximum [cm] | Minimum [cm] |
|---|---|---|---|
| 31.12.2015 | 193 | 197 | 190 |
| 30.12.2015 | 192 | 193 | 191 |
| 29.12.2015 | 193 | 194 | 192 |
| 28.12.2015 | 193 | 195 | 193 |
| 27.12.2015 | 195 | 196 | 194 |
| 26.12.2015 | 196 | 198 | 195 |
| 25.12.2015 | 198 | 201 | 197 |
© Bayerisches Landesamt für Umwelt 2024