
- Start >
- Rivers >
- Waterlevel >
- Regnitz >
- Lauf >
- Chart of total period

Chart of total period Lauf / Pegnitz
Waterlevel from 01.11.1969 to 24.04.2024
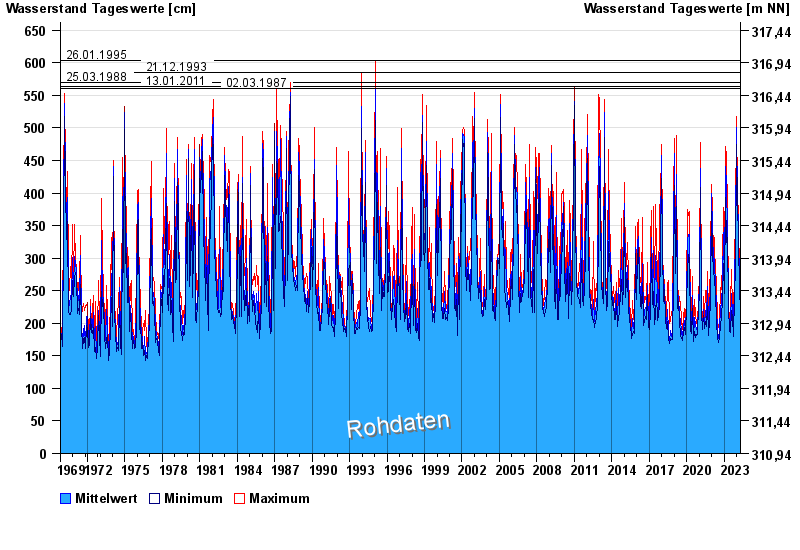
- 26.01.1995 Wasserstand: 604 cm
- 21.12.1993 Wasserstand: 585 cm
- 25.03.1988 Wasserstand: 570 cm
- 13.01.2011 Wasserstand: 563 cm
- 02.03.1987 Wasserstand: 561 cm
| Date | Mean value [cm] | Maximum [cm] | Minimum [cm] |
|---|---|---|---|
| 24.04.2024 | 245 | 246 | 244 |
| 23.04.2024 | 253 | 258 | 246 |
| 22.04.2024 | 263 | 276 | 257 |
| 21.04.2024 | 268 | 282 | 254 |
| 20.04.2024 | 271 | 294 | 254 |
| 19.04.2024 | 230 | 278 | 208 |
| 18.04.2024 | 221 | 233 | 215 |
© Bayerisches Landesamt für Umwelt 2024