
- Start >
- Rivers >
- Waterlevel >
- Regnitz >
- Laubendorf >
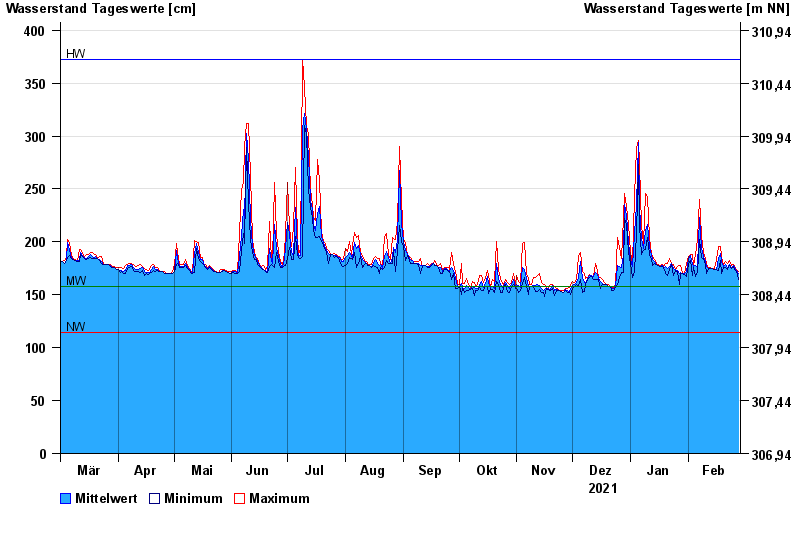
- Chart of year

Chart of year Laubendorf / Zenn
Waterlevel from 01.03.2021 to 28.02.2022
| Date | Mean value [cm] | Maximum [cm] | Minimum [cm] |
|---|---|---|---|
| 28.02.2022 | 170 | 172 | 164 |
| 27.02.2022 | 173 | 174 | 172 |
| 26.02.2022 | 176 | 177 | 174 |
| 25.02.2022 | 178 | 179 | 177 |
| 24.02.2022 | 176 | 178 | 175 |
| 23.02.2022 | 179 | 182 | 178 |
| 22.02.2022 | 176 | 180 | 174 |
© Bayerisches Landesamt für Umwelt 2024