
- Start >
- Rivers >
- Waterlevel >
- Regnitz >
- Laubendorf >
- Chart of total period

Chart of total period Laubendorf / Zenn
Waterlevel from 01.11.1963 to 25.04.2024
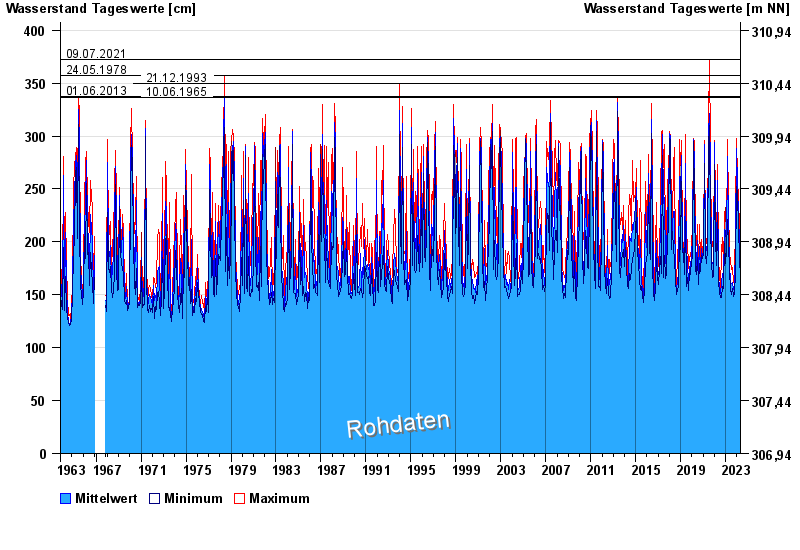
- 09.07.2021 Wasserstand: 372 cm
- 24.05.1978 Wasserstand: 357 cm
- 21.12.1993 Wasserstand: 350 cm
- 01.06.2013 Wasserstand: 337 cm
- 10.06.1965 Wasserstand: 336 cm
| Date | Mean value [cm] | Maximum [cm] | Minimum [cm] |
|---|---|---|---|
| 25.04.2024 | 162 | 162 | 160 |
| 24.04.2024 | 162 | 164 | 162 |
| 23.04.2024 | 165 | 168 | 164 |
| 22.04.2024 | 172 | 176 | 164 |
| 21.04.2024 | 167 | 174 | 164 |
| 20.04.2024 | 171 | 175 | 165 |
| 19.04.2024 | 165 | 174 | 160 |
© Bayerisches Landesamt für Umwelt 2024