
- Start >
- Rivers >
- Waterlevel >
- Regnitz >
- Kreppendorf >
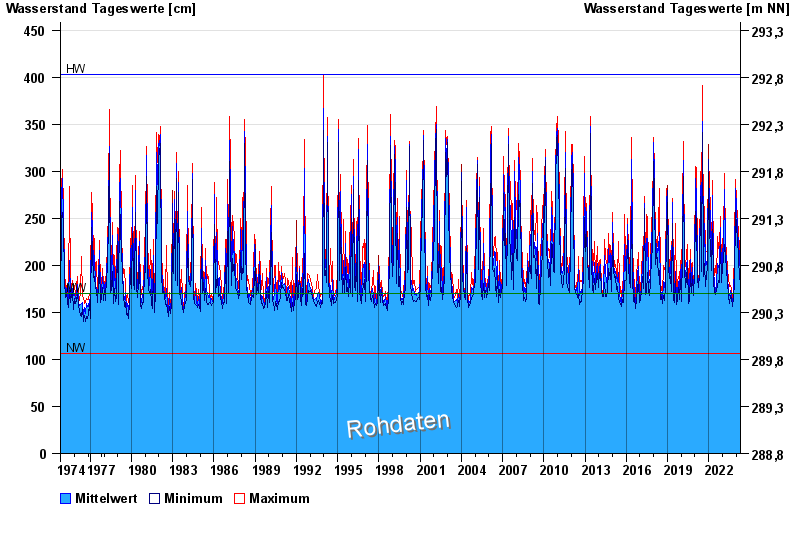
- Chart of total period

Chart of total period Kreppendorf / Zenn
Waterlevel from 01.11.1974 to 25.04.2024
| Date | Mean value [cm] | Maximum [cm] | Minimum [cm] |
|---|---|---|---|
| 25.04.2024 | 176 | 179 | 175 |
| 24.04.2024 | 176 | 178 | 173 |
| 23.04.2024 | 180 | 182 | 177 |
| 22.04.2024 | 188 | 191 | 181 |
| 21.04.2024 | 182 | 188 | 180 |
| 20.04.2024 | 189 | 194 | 183 |
| 19.04.2024 | 180 | 195 | 174 |
© Bayerisches Landesamt für Umwelt 2024