
- Start >
- Rivers >
- Waterlevel >
- Regnitz >
- Hohenstadt >
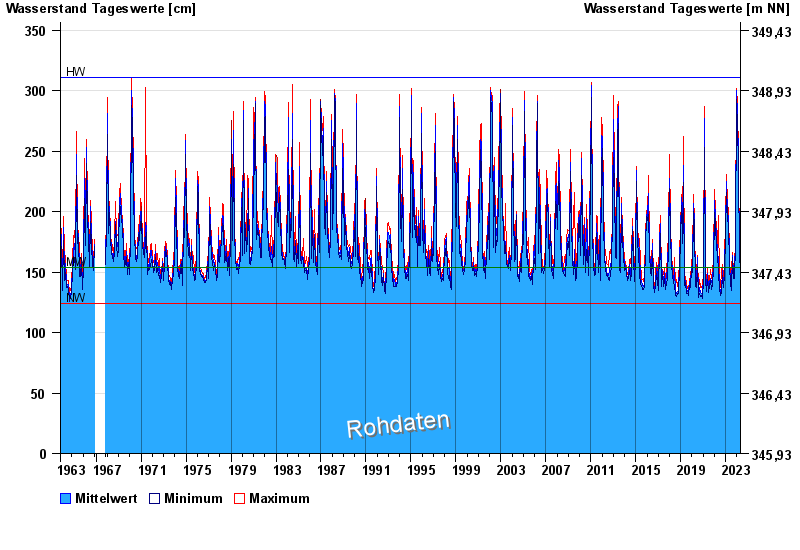
- Chart of total period

Chart of total period Hohenstadt / Pegnitz
Waterlevel from 01.11.1963 to 24.04.2024
| Date | Mean value [cm] | Maximum [cm] | Minimum [cm] |
|---|---|---|---|
| 24.04.2024 | 165 | 167 | 164 |
| 23.04.2024 | 172 | 180 | 164 |
| 22.04.2024 | 177 | 183 | 172 |
| 21.04.2024 | 174 | 176 | 171 |
| 20.04.2024 | 167 | 173 | 162 |
| 19.04.2024 | 159 | 171 | 154 |
| 18.04.2024 | 154 | 156 | 152 |
© Bayerisches Landesamt für Umwelt 2024