
- Start >
- Rivers >
- Waterlevel >
- Regnitz >
- Füssen >
- Chart of year

Chart of year Füssen / Lech
Waterlevel from 07.12.2019 to 06.12.2020
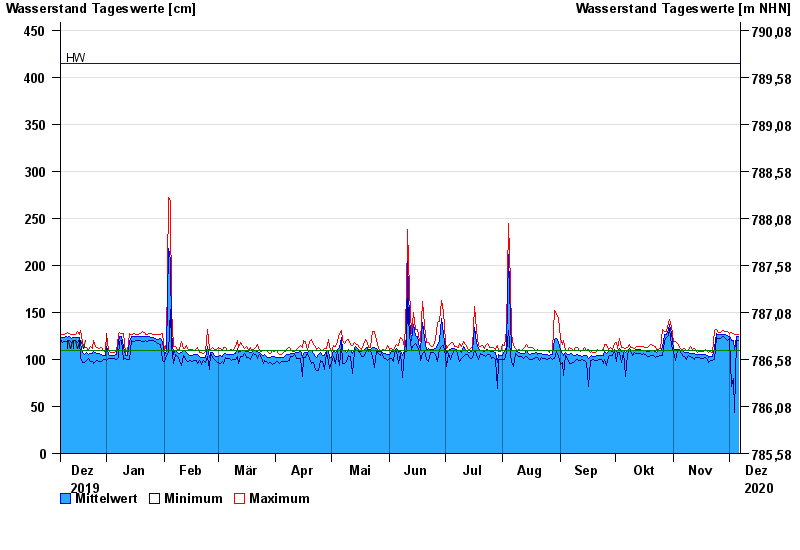
| Date | Mean value [cm] | Maximum [cm] | Minimum [cm] |
|---|---|---|---|
| 06.12.2020 | 124 | 127 | 120 |
| 05.12.2020 | 124 | 127 | 120 |
| 04.12.2020 | 110 | 127 | 44 |
| 03.12.2020 | 120 | 128 | 80 |
| 02.12.2020 | 120 | 129 | 71 |
| 01.12.2020 | 124 | 128 | 122 |
| 30.11.2020 | 125 | 130 | 120 |
© Bayerisches Landesamt für Umwelt 2024