
- Start >
- Rivers >
- Waterlevel >
- Regnitz >
- Erlangen >
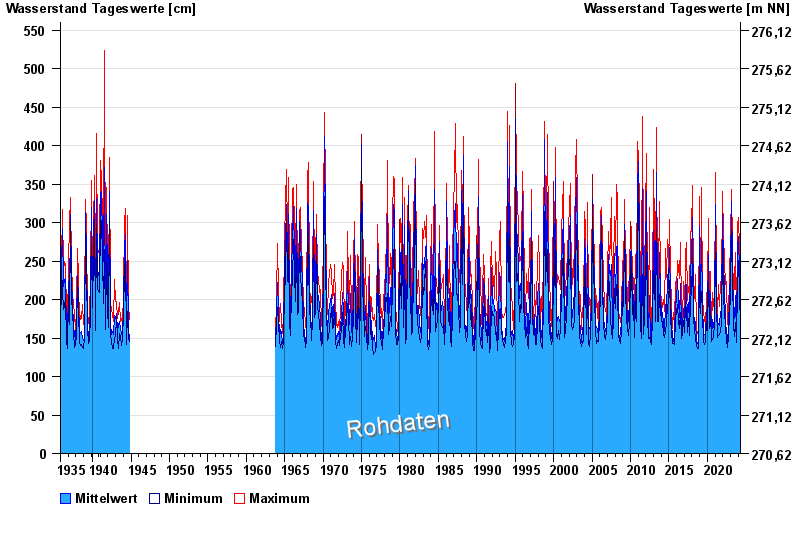
- Chart of total period

Chart of total period Erlangen / Schwabach
Waterlevel from 28.10.1935 to 25.04.2024
| Date | Mean value [cm] | Maximum [cm] | Minimum [cm] |
|---|---|---|---|
| 25.04.2024 | 158 | 158 | 158 |
| 24.04.2024 | 159 | 160 | 158 |
| 23.04.2024 | 162 | 165 | 159 |
| 22.04.2024 | 172 | 186 | 165 |
| 21.04.2024 | 177 | 226 | 160 |
| 20.04.2024 | 169 | 180 | 159 |
| 19.04.2024 | 154 | 171 | 151 |
© Bayerisches Landesamt für Umwelt 2024