
- Start >
- Rivers >
- Waterlevel >
- Regnitz >
- Büg >
- Chart of year

Chart of year Büg / Schwabach
Waterlevel from 28.01.2020 to 27.01.2021
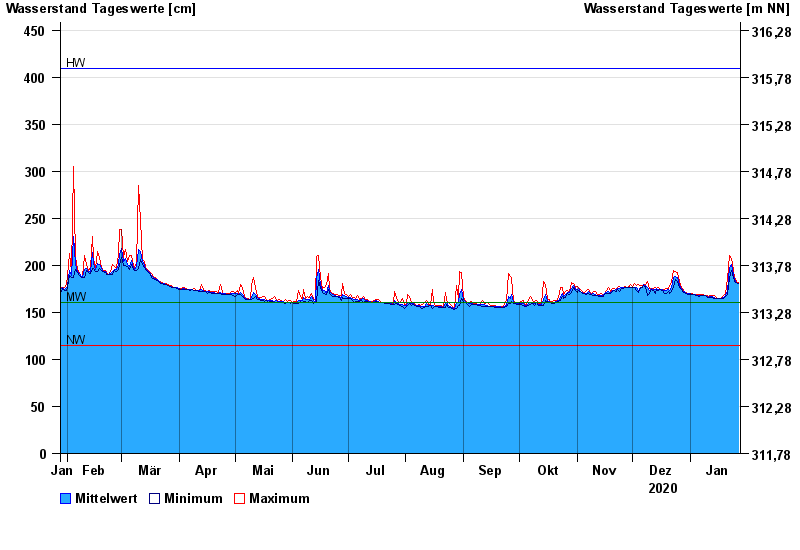
| Date | Mean value [cm] | Maximum [cm] | Minimum [cm] |
|---|---|---|---|
| 27.01.2021 | 181 | 182 | 181 |
| 26.01.2021 | 182 | 183 | 182 |
| 25.01.2021 | 185 | 187 | 183 |
| 24.01.2021 | 190 | 195 | 187 |
| 23.01.2021 | 201 | 207 | 195 |
| 22.01.2021 | 198 | 210 | 186 |
| 21.01.2021 | 173 | 186 | 169 |
© Bayerisches Landesamt für Umwelt 2024