
- Start >
- Rivers >
- Waterlevel >
- Regnitz >
- Büg >
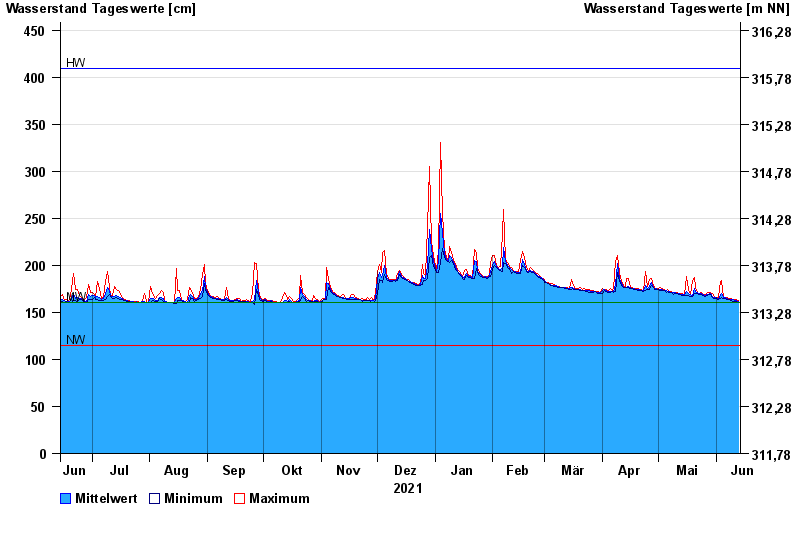
- Chart of year

Chart of year Büg / Schwabach
Waterlevel from 14.06.2021 to 13.06.2022
| Date | Mean value [cm] | Maximum [cm] | Minimum [cm] |
|---|---|---|---|
| 13.06.2022 | 162 | 163 | 161 |
| 12.06.2022 | 163 | 164 | 162 |
| 11.06.2022 | 163 | 164 | 162 |
| 10.06.2022 | 164 | 164 | 162 |
| 09.06.2022 | 164 | 165 | 163 |
| 08.06.2022 | 164 | 165 | 164 |
| 07.06.2022 | 165 | 166 | 164 |
© Bayerisches Landesamt für Umwelt 2024