
- Start >
- Rivers >
- Waterlevel >
- Regnitz >
- Büg >
- Chart of year

Chart of year Büg / Schwabach
Waterlevel from 01.10.2020 to 30.09.2021
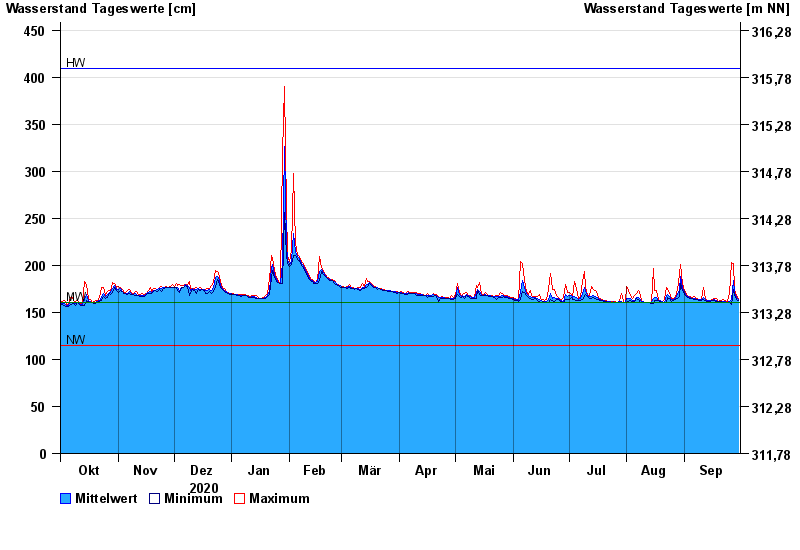
| Date | Mean value [cm] | Maximum [cm] | Minimum [cm] |
|---|---|---|---|
| 30.09.2021 | 164 | 164 | 163 |
| 29.09.2021 | 166 | 168 | 164 |
| 28.09.2021 | 171 | 174 | 168 |
| 27.09.2021 | 184 | 202 | 174 |
| 26.09.2021 | 164 | 203 | 158 |
| 25.09.2021 | 162 | 170 | 161 |
| 24.09.2021 | 161 | 162 | 160 |
© Bayerisches Landesamt für Umwelt 2024