
- Start >
- Rivers >
- Waterlevel >
- Regnitz >
- Büg >
- Chart of year

Chart of year Büg / Schwabach
Waterlevel from 01.01.2021 to 31.12.2021
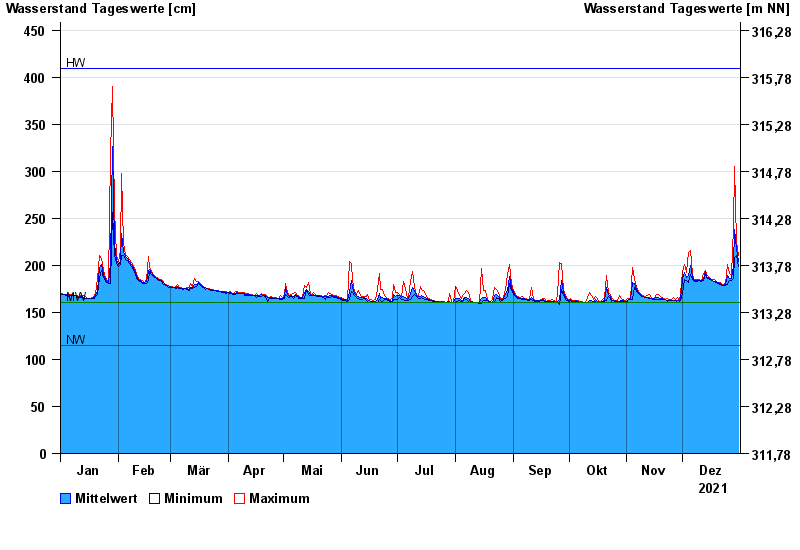
| Date | Mean value [cm] | Maximum [cm] | Minimum [cm] |
|---|---|---|---|
| 31.12.2021 | 204 | 210 | 199 |
| 30.12.2021 | 217 | 225 | 210 |
| 29.12.2021 | 238 | 305 | 208 |
| 28.12.2021 | 200 | 240 | 186 |
| 27.12.2021 | 186 | 189 | 184 |
| 26.12.2021 | 186 | 191 | 184 |
| 25.12.2021 | 189 | 201 | 180 |
© Bayerisches Landesamt für Umwelt 2024