
- Start >
- Rivers >
- Waterlevel >
- Regnitz >
- Büg >
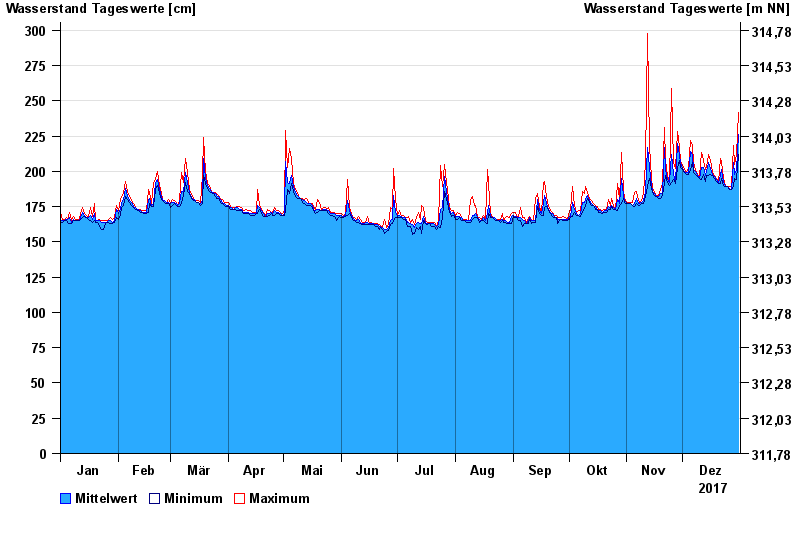
- Chart of year

Chart of year Büg / Schwabach
Waterlevel from 01.01.2017 to 31.12.2017
- 20.07.2011 Wasserstand: 409 cm
- 28.10.1998 Wasserstand: 404 cm
- 26.01.1995 Wasserstand: 401 cm
- 29.01.2021 Wasserstand: 390 cm
- 19.07.1966 Wasserstand: 390 cm
| Date | Mean value [cm] | Maximum [cm] | Minimum [cm] |
|---|---|---|---|
| 31.12.2017 | 226 | 242 | 212 |
| 30.12.2017 | 201 | 212 | 194 |
| 29.12.2017 | 198 | 205 | 195 |
| 28.12.2017 | 206 | 218 | 189 |
| 27.12.2017 | 187 | 189 | 187 |
| 26.12.2017 | 188 | 189 | 187 |
| 25.12.2017 | 189 | 189 | 189 |
© Bayerisches Landesamt für Umwelt 2024