
- Start >
- Rivers >
- Waterlevel >
- Regnitz >
- Büg >
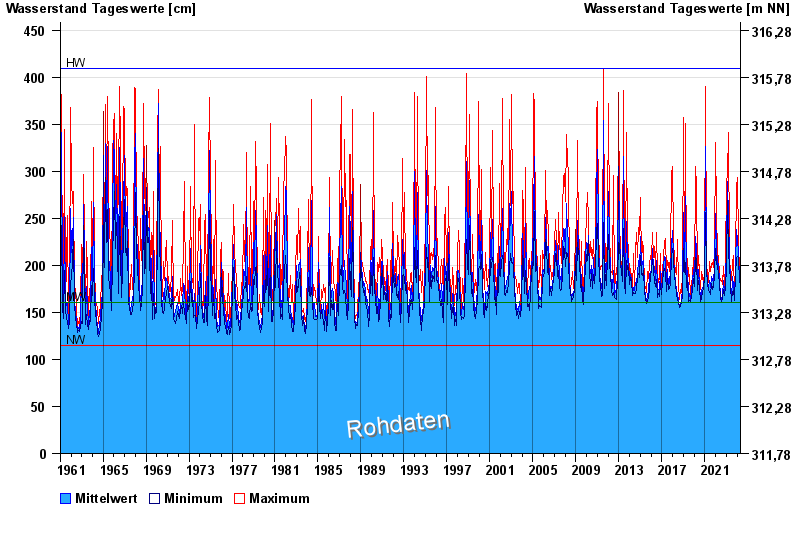
- Chart of total period

Chart of total period Büg / Schwabach
Waterlevel from 16.01.1961 to 25.04.2024
| Date | Mean value [cm] | Maximum [cm] | Minimum [cm] |
|---|---|---|---|
| 25.04.2024 | 174 | 175 | 174 |
| 24.04.2024 | 176 | 178 | 174 |
| 23.04.2024 | 178 | 180 | 174 |
| 22.04.2024 | 183 | 187 | 180 |
| 21.04.2024 | 190 | 207 | 176 |
| 20.04.2024 | 180 | 188 | 176 |
| 19.04.2024 | 178 | 191 | 171 |
© Bayerisches Landesamt für Umwelt 2024