
- Start >
- Rivers >
- Waterlevel >
- Regnitz >
- Büg >
- Chart of total period

Chart of total period Büg / Schwabach
Waterlevel from 16.01.1961 to 19.04.2024
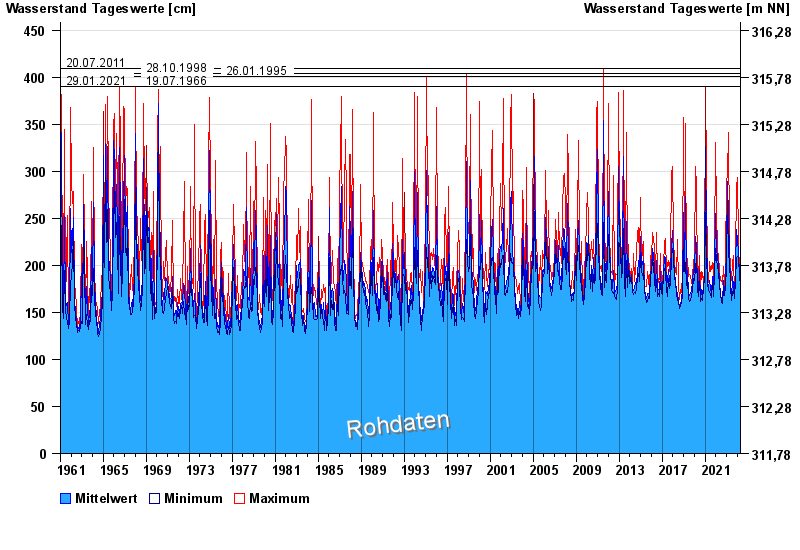
- 20.07.2011 Wasserstand: 409 cm
- 28.10.1998 Wasserstand: 404 cm
- 26.01.1995 Wasserstand: 401 cm
- 29.01.2021 Wasserstand: 390 cm
- 19.07.1966 Wasserstand: 390 cm
| Date | Mean value [cm] | Maximum [cm] | Minimum [cm] |
|---|---|---|---|
| 19.04.2024 | 172 | 172 | 171 |
| 18.04.2024 | 172 | 173 | 172 |
| 17.04.2024 | 173 | 175 | 169 |
| 16.04.2024 | 173 | 179 | 171 |
| 15.04.2024 | 172 | 173 | 171 |
| 14.04.2024 | 172 | 172 | 171 |
| 13.04.2024 | 172 | 173 | 172 |
© Bayerisches Landesamt für Umwelt 2024