
- Start >
- Rivers >
- Waterlevel >
- Regnitz >
- Ansbach >
- Chart of total period

Chart of total period Ansbach / Hennenbach
Waterlevel from 16.07.2019 to 18.04.2024
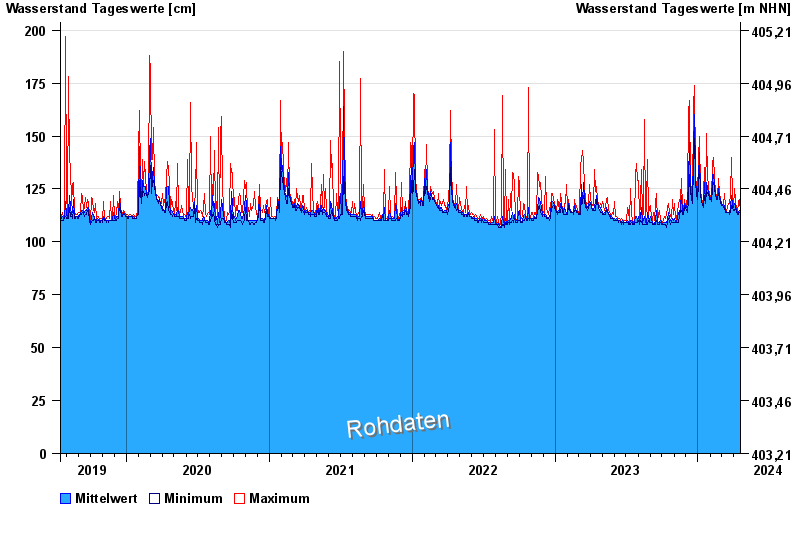
| Date | Mean value [cm] | Maximum [cm] | Minimum [cm] |
|---|---|---|---|
| 18.04.2024 | 114 | 114 | 113 |
| 17.04.2024 | 115 | 117 | 114 |
| 16.04.2024 | 115 | 120 | 113 |
| 15.04.2024 | 114 | 119 | 113 |
| 14.04.2024 | 113 | 115 | 113 |
| 13.04.2024 | 113 | 114 | 113 |
| 12.04.2024 | 113 | 114 | 113 |
© Bayerisches Landesamt für Umwelt 2024