
- Start >
- Rivers >
- Waterlevel >
- Regnitz >
- Ansbach >
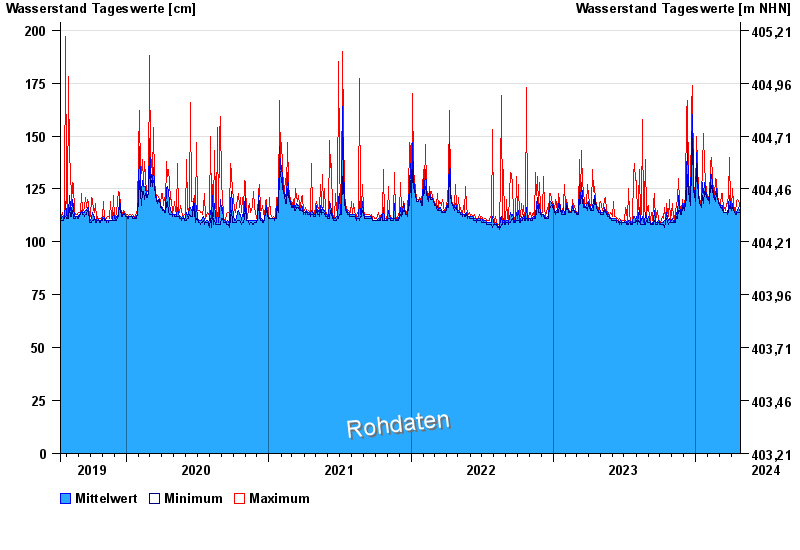
- Chart of total period

Chart of total period Ansbach / Hennenbach
Waterlevel from 16.07.2019 to 24.04.2024
 Für diesen Pegel sind keine historische Ereignisse hinterlegt.
| Date | Mean value [cm] | Maximum [cm] | Minimum [cm] |
|---|---|---|---|
| 24.04.2024 | 114 | 114 | 114 |
| 23.04.2024 | 114 | 115 | 114 |
| 22.04.2024 | 115 | 118 | 114 |
| 21.04.2024 | 115 | 117 | 114 |
| 20.04.2024 | 116 | 117 | 114 |
| 19.04.2024 | 116 | 119 | 113 |
| 18.04.2024 | 114 | 114 | 113 |
© Bayerisches Landesamt für Umwelt 2024