
- Start >
- Rivers >
- Waterlevel >
- Regnitz >
- Aha >
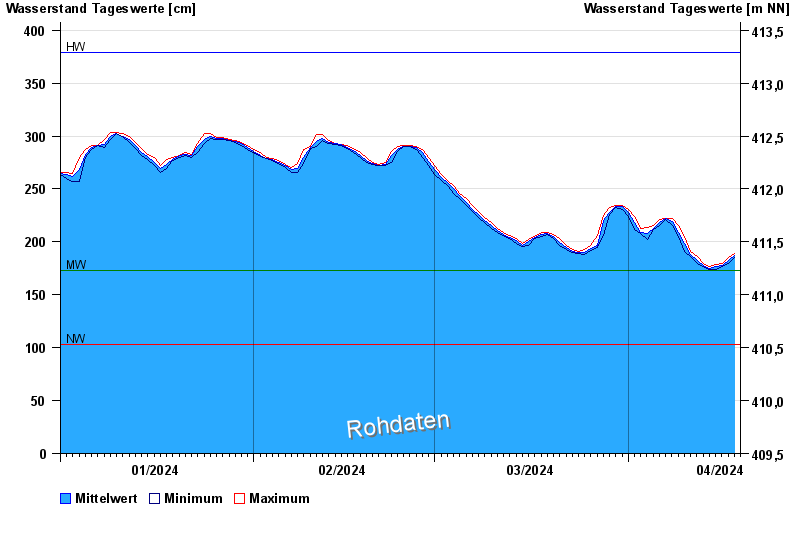
- Chart of year

Chart of year Aha / Altmühl
Waterlevel from 01.01.2024 to 18.04.2024
| Date | Mean value [cm] | Maximum [cm] | Minimum [cm] |
|---|---|---|---|
| 18.04.2024 | 187 | 189 | 185 |
| 17.04.2024 | 182 | 185 | 180 |
| 16.04.2024 | 178 | 180 | 177 |
| 15.04.2024 | 177 | 179 | 174 |
| 14.04.2024 | 175 | 177 | 174 |
| 13.04.2024 | 178 | 180 | 177 |
| 12.04.2024 | 182 | 186 | 180 |
© Bayerisches Landesamt für Umwelt 2024