
- Start >
- Rivers >
- Waterlevel >
- Untere Donau >
- Wallersdorf >
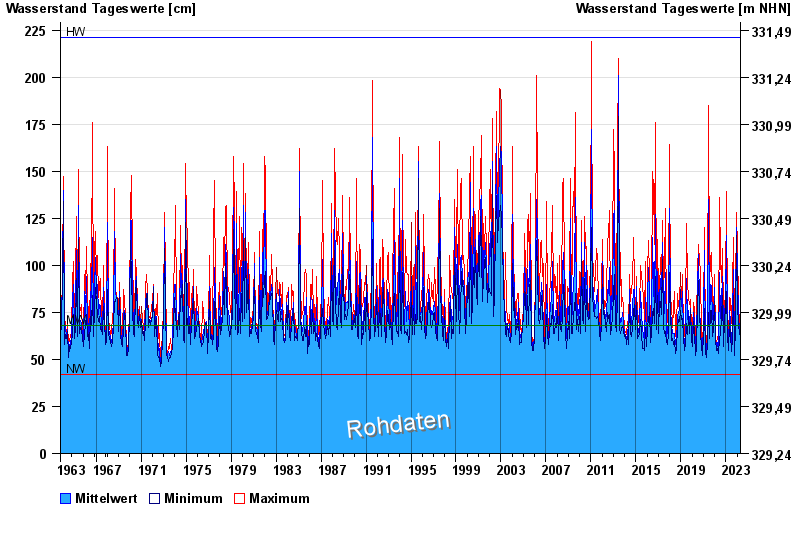
- Chart of total period

Chart of total period Wallersdorf / Reißingerbach
Waterlevel from 01.11.1963 to 18.04.2024
| Date | Mean value [cm] | Maximum [cm] | Minimum [cm] |
|---|---|---|---|
| 18.04.2024 | 60 | 60 | 59 |
| 17.04.2024 | 61 | 67 | 58 |
| 16.04.2024 | 60 | 66 | 57 |
| 15.04.2024 | 62 | 72 | 59 |
| 14.04.2024 | 61 | 64 | 57 |
| 13.04.2024 | 61 | 64 | 57 |
| 12.04.2024 | 61 | 65 | 58 |
© Bayerisches Landesamt für Umwelt 2024