
- Start >
- Rivers >
- Waterlevel >
- Untere Donau >
- Vohburg >
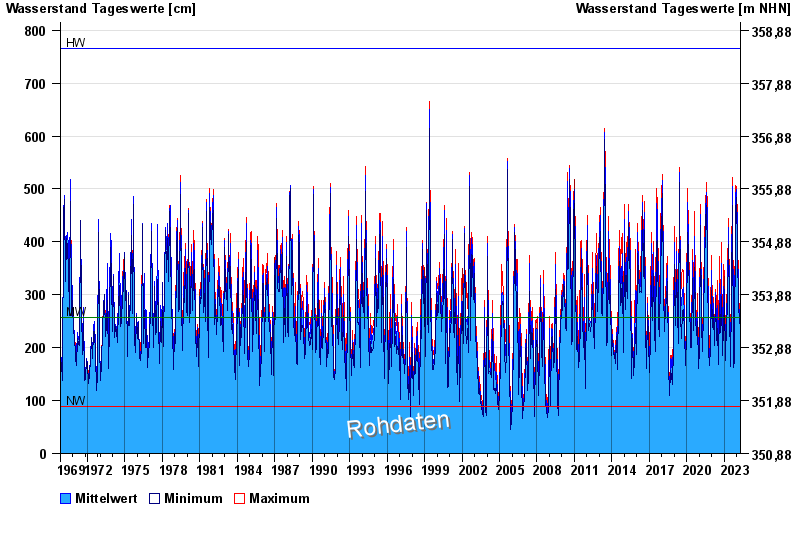
- Chart of total period

Chart of total period Vohburg / Donau
Waterlevel from 01.11.1969 to 19.04.2024
| Date | Mean value [cm] | Maximum [cm] | Minimum [cm] |
|---|---|---|---|
| 19.04.2024 | 248 | 249 | 245 |
| 18.04.2024 | 250 | 257 | 233 |
| 17.04.2024 | 240 | 246 | 233 |
| 16.04.2024 | 239 | 245 | 232 |
| 15.04.2024 | 222 | 232 | 217 |
| 14.04.2024 | 218 | 221 | 213 |
| 13.04.2024 | 215 | 219 | 211 |
© Bayerisches Landesamt für Umwelt 2024