
- Start >
- Rivers >
- Waterlevel >
- Untere Donau >
- Staudach >
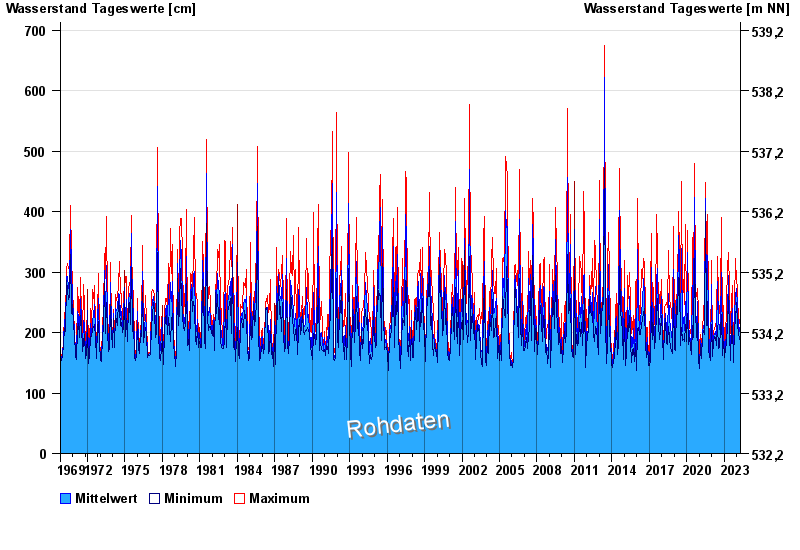
- Chart of total period

Chart of total period Staudach / Tiroler Achen
Waterlevel from 01.11.1969 to 23.04.2024
| Date | Mean value [cm] | Maximum [cm] | Minimum [cm] |
|---|---|---|---|
| 23.04.2024 | 179 | 181 | 177 |
| 22.04.2024 | 184 | 192 | 180 |
| 21.04.2024 | 187 | 193 | 183 |
| 20.04.2024 | 186 | 191 | 180 |
| 19.04.2024 | 174 | 179 | 172 |
| 18.04.2024 | 177 | 181 | 176 |
| 17.04.2024 | 180 | 184 | 179 |
© Bayerisches Landesamt für Umwelt 2024