
- Start >
- Rivers >
- Waterlevel >
- Untere Donau >
- Staudach >
- Chart of total period

Chart of total period Staudach / Tiroler Achen
Waterlevel from 01.11.1969 to 19.04.2024
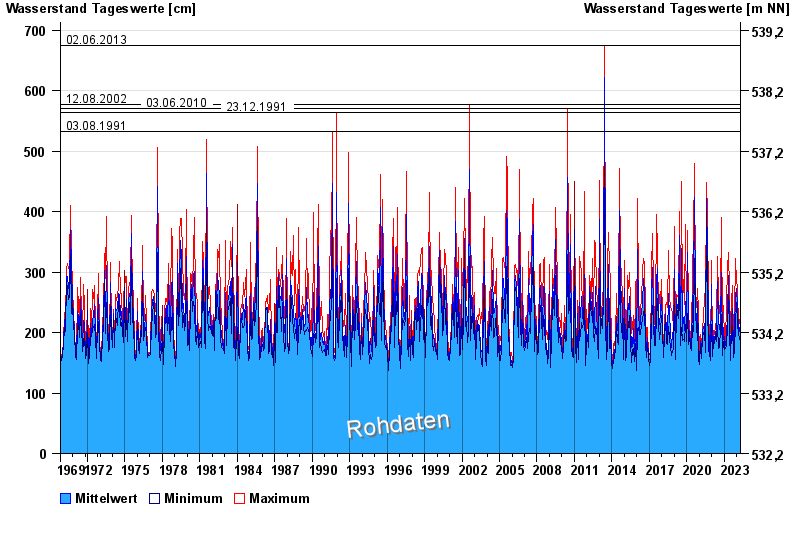
- 02.06.2013 Wasserstand: 675 cm
- 12.08.2002 Wasserstand: 577 cm
- 03.06.2010 Wasserstand: 571 cm
- 23.12.1991 Wasserstand: 564 cm
- 03.08.1991 Wasserstand: 532 cm
| Date | Mean value [cm] | Maximum [cm] | Minimum [cm] |
|---|---|---|---|
| 19.04.2024 | 174 | 177 | 172 |
| 18.04.2024 | 177 | 181 | 176 |
| 17.04.2024 | 180 | 184 | 179 |
| 16.04.2024 | 193 | 210 | 184 |
| 15.04.2024 | 178 | 184 | 175 |
| 14.04.2024 | 176 | 182 | 172 |
| 13.04.2024 | 173 | 180 | 170 |
© Bayerisches Landesamt für Umwelt 2024