
- Start >
- Rivers >
- Waterlevel >
- Untere Donau >
- Schwandorf >
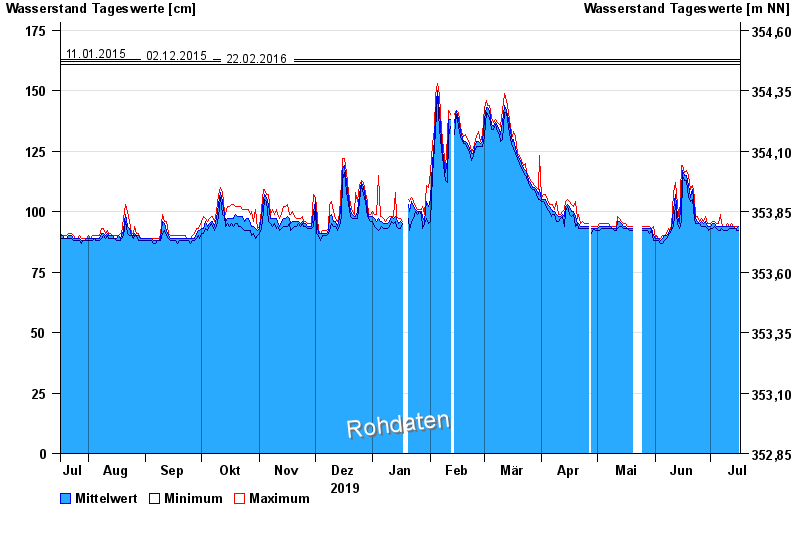
- Chart of year

Chart of year Schwandorf / Naab
Waterlevel from 17.07.2019 to 16.07.2020
note
Pegel bis auf Weiteres außer Betrieb wegen Brückenbauarbeiten.
- 04.06.2013 Wasserstand: 239 cm
- 25.12.2012 Wasserstand: 200 cm
- 11.01.2015 Wasserstand: 163 cm
- 02.12.2015 Wasserstand: 162 cm
- 22.02.2016 Wasserstand: 161 cm
| Date | Mean value [cm] | Maximum [cm] | Minimum [cm] |
|---|---|---|---|
| 16.07.2020 | 94 | 94 | 92 |
| 15.07.2020 | 93 | 94 | 92 |
| 14.07.2020 | 93 | 94 | 93 |
| 13.07.2020 | 94 | 94 | 93 |
| 12.07.2020 | 94 | 95 | 93 |
| 11.07.2020 | 94 | 94 | 93 |
| 10.07.2020 | 94 | 95 | 92 |
© Bayerisches Landesamt für Umwelt 2024