
- Start >
- Rivers >
- Waterlevel >
- Untere Donau >
- Postmünster >
- Chart of total period

Chart of total period Postmünster / Rott
Waterlevel from 10.02.1972 to 19.04.2024
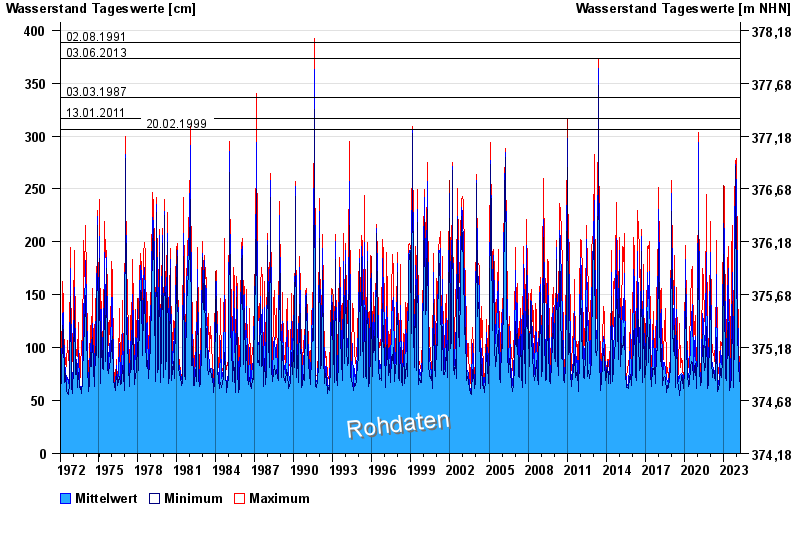
- 02.08.1991 Wasserstand: 388 cm
- 03.06.2013 Wasserstand: 373 cm
- 03.03.1987 Wasserstand: 336 cm
- 13.01.2011 Wasserstand: 317 cm
- 20.02.1999 Wasserstand: 306 cm
| Date | Mean value [cm] | Maximum [cm] | Minimum [cm] |
|---|---|---|---|
| 19.04.2024 | 69 | 90 | 60 |
| 18.04.2024 | 69 | 71 | 67 |
| 17.04.2024 | 66 | 67 | 66 |
| 16.04.2024 | 71 | 75 | 66 |
| 15.04.2024 | 65 | 74 | 61 |
| 14.04.2024 | 61 | 61 | 61 |
| 13.04.2024 | 61 | 62 | 61 |
© Bayerisches Landesamt für Umwelt 2024