
- Start >
- Rivers >
- Waterlevel >
- Untere Donau >
- Plattling >
- Chart of total period

Chart of total period Plattling / Isar
Waterlevel from 01.01.1900 to 25.04.2024
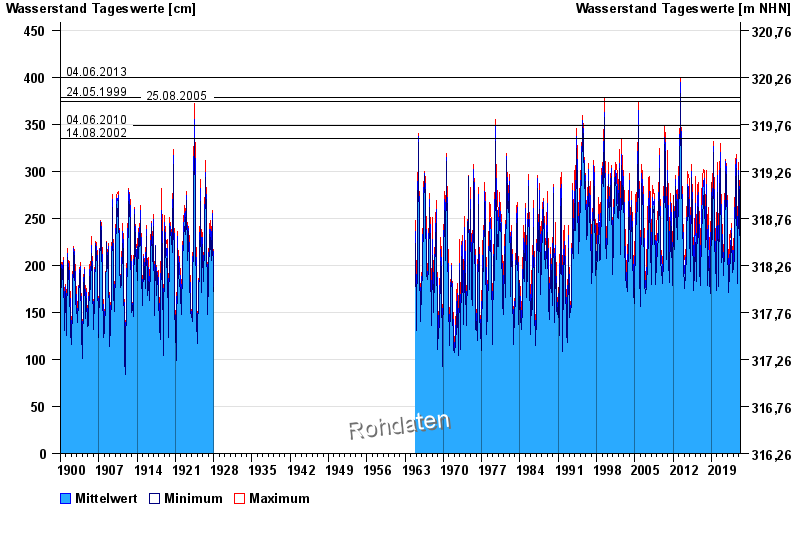
- 04.06.2013 Wasserstand: 400 cm
- 24.05.1999 Wasserstand: 378 cm
- 25.08.2005 Wasserstand: 374 cm
- 04.06.2010 Wasserstand: 349 cm
- 14.08.2002 Wasserstand: 335 cm
| Date | Mean value [cm] | Maximum [cm] | Minimum [cm] |
|---|---|---|---|
| 25.04.2024 | 201 | 201 | 201 |
| 24.04.2024 | 203 | 207 | 197 |
| 23.04.2024 | 198 | 208 | 189 |
| 22.04.2024 | 198 | 209 | 189 |
| 21.04.2024 | 187 | 193 | 181 |
| 20.04.2024 | 189 | 193 | 185 |
| 19.04.2024 | 187 | 191 | 180 |
© Bayerisches Landesamt für Umwelt 2024