
- Start >
- Rivers >
- Waterlevel >
- Untere Donau >
- Passau Ingling >
- Chart of total period

Chart of total period Passau Ingling / Inn
Waterlevel from 01.11.1969 to 25.04.2024
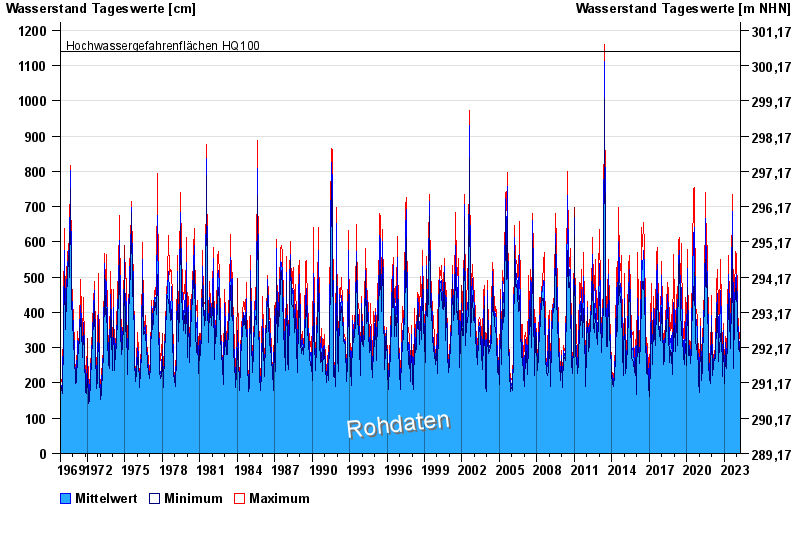
- Hochwassergefahrenfläche HQ100 1140 cm
| Date | Mean value [cm] | Maximum [cm] | Minimum [cm] |
|---|---|---|---|
| 25.04.2024 | 260 | 267 | 254 |
| 24.04.2024 | 269 | 277 | 261 |
| 23.04.2024 | 282 | 292 | 269 |
| 22.04.2024 | 283 | 294 | 275 |
| 21.04.2024 | 286 | 294 | 276 |
| 20.04.2024 | 290 | 298 | 277 |
| 19.04.2024 | 294 | 308 | 281 |
© Bayerisches Landesamt für Umwelt 2024