
- Start >
- Rivers >
- Waterlevel >
- Untere Donau >
- Passau >
- Chart of total period

Chart of total period Passau / Donau
Waterlevel from 01.11.1969 to 24.04.2024
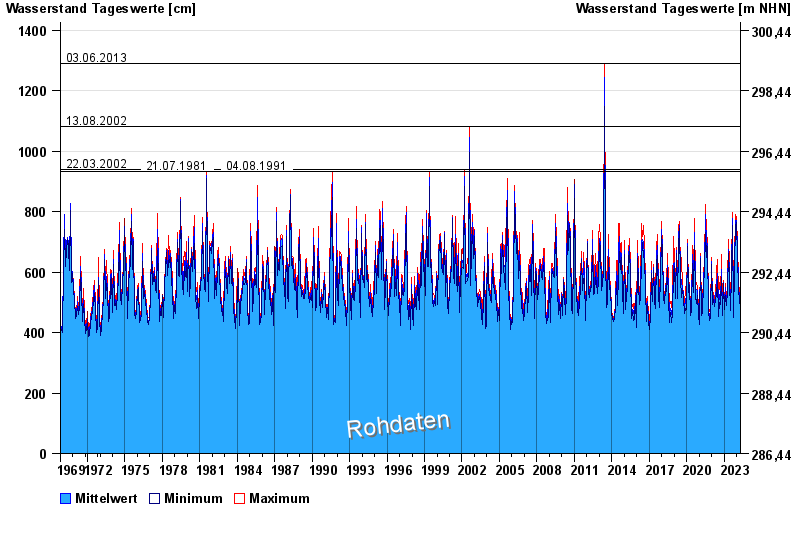
- 03.06.2013 Wasserstand: 1289 cm
- 13.08.2002 Wasserstand: 1081 cm
- 22.03.2002 Wasserstand: 939 cm
- 21.07.1981 Wasserstand: 934 cm
- 04.08.1991 Wasserstand: 932 cm
| Date | Mean value [cm] | Maximum [cm] | Minimum [cm] |
|---|---|---|---|
| 24.04.2024 | 499 | 504 | 495 |
| 23.04.2024 | 511 | 517 | 503 |
| 22.04.2024 | 515 | 523 | 509 |
| 21.04.2024 | 512 | 518 | 506 |
| 20.04.2024 | 512 | 517 | 505 |
| 19.04.2024 | 510 | 515 | 504 |
| 18.04.2024 | 514 | 519 | 512 |
© Bayerisches Landesamt für Umwelt 2024