
- Start >
- Rivers >
- Waterlevel >
- Untere Donau >
- Oberndorf >
- Chart of total period

Chart of total period Oberndorf / Donau
Waterlevel from 01.11.1975 to 20.04.2024
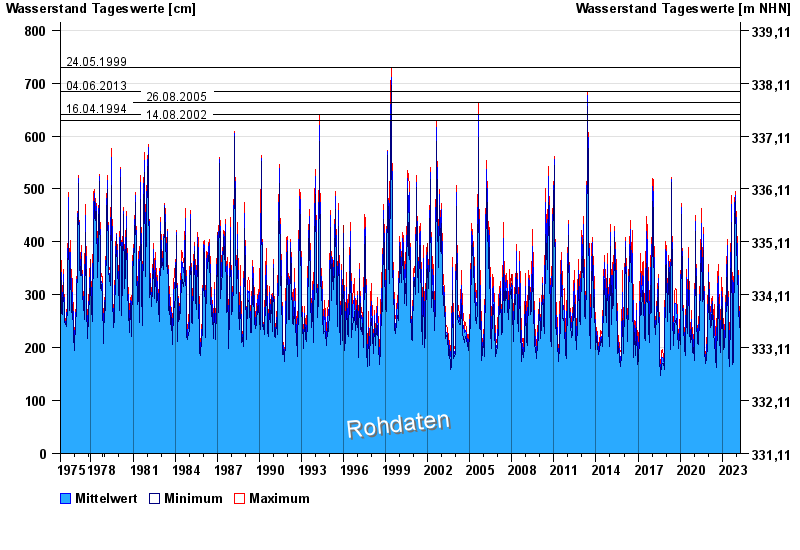
- 24.05.1999 Wasserstand: 730 cm
- 04.06.2013 Wasserstand: 684 cm
- 26.08.2005 Wasserstand: 664 cm
- 16.04.1994 Wasserstand: 641 cm
- 14.08.2002 Wasserstand: 630 cm
| Date | Mean value [cm] | Maximum [cm] | Minimum [cm] |
|---|---|---|---|
| 20.04.2024 | 240 | 241 | 238 |
| 19.04.2024 | 242 | 247 | 237 |
| 18.04.2024 | 243 | 251 | 233 |
| 17.04.2024 | 239 | 242 | 235 |
| 16.04.2024 | 233 | 241 | 225 |
| 15.04.2024 | 222 | 227 | 216 |
| 14.04.2024 | 220 | 224 | 213 |
© Bayerisches Landesamt für Umwelt 2024