
- Start >
- Rivers >
- Waterlevel >
- Untere Donau >
- Neusling >
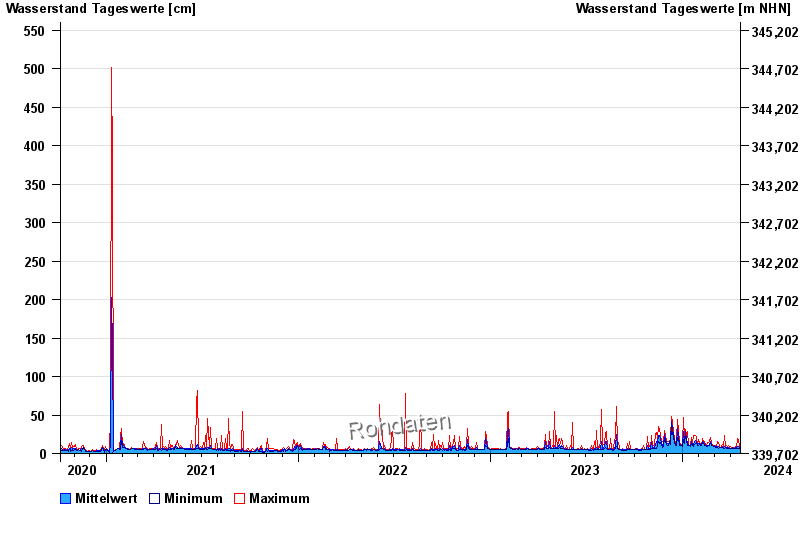
- Chart of total period

Chart of total period Neusling / Neuslinger Graben
Waterlevel from 06.10.2020 to 19.04.2024
 Für diesen Pegel sind keine historische Ereignisse hinterlegt.
| Date | Mean value [cm] | Maximum [cm] | Minimum [cm] |
|---|---|---|---|
| 19.04.2024 | 7 | 7 | 7 |
| 18.04.2024 | 7 | 8 | 7 |
| 17.04.2024 | 9 | 17 | 7 |
| 16.04.2024 | 8 | 17 | 7 |
| 15.04.2024 | 9 | 19 | 6 |
| 14.04.2024 | 7 | 7 | 6 |
| 13.04.2024 | 7 | 7 | 7 |
© Bayerisches Landesamt für Umwelt 2024