
- Start >
- Rivers >
- Waterlevel >
- Untere Donau >
- Moosburg >
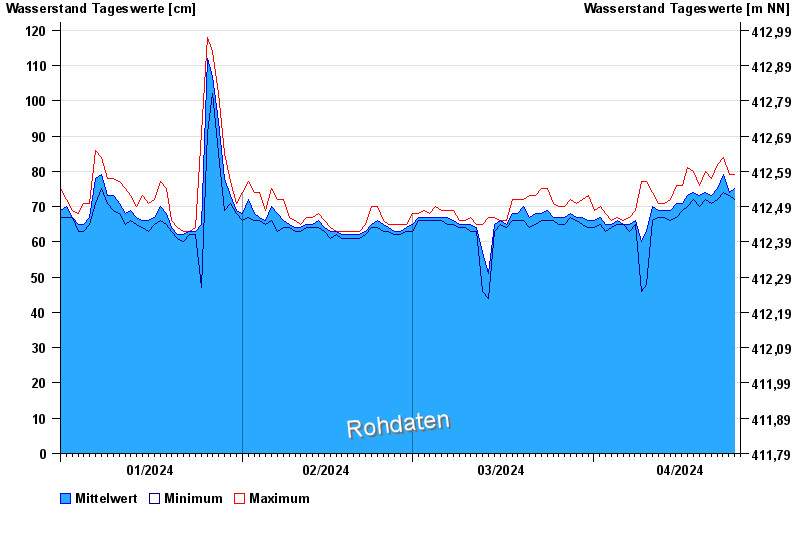
- Chart of year

Chart of year Moosburg / Isar
Waterlevel from 01.01.2024 to 25.04.2024
- 07.10.2009 Wasserstand: 523 cm
- 03.06.2013 Wasserstand: 361 cm
- 04.06.2010 Wasserstand: 314 cm
- 05.08.2020 Wasserstand: 282 cm
- 24.09.2009 Wasserstand: 252 cm
| Date | Mean value [cm] | Maximum [cm] | Minimum [cm] |
|---|---|---|---|
| 25.04.2024 | 74 | 79 | 72 |
| 24.04.2024 | 74 | 79 | 73 |
| 23.04.2024 | 79 | 84 | 74 |
| 22.04.2024 | 75 | 82 | 72 |
| 21.04.2024 | 73 | 78 | 71 |
| 20.04.2024 | 74 | 80 | 72 |
| 19.04.2024 | 73 | 76 | 70 |
© Bayerisches Landesamt für Umwelt 2024