
- Start >
- Rivers >
- Waterlevel >
- Untere Donau >
- Linden >
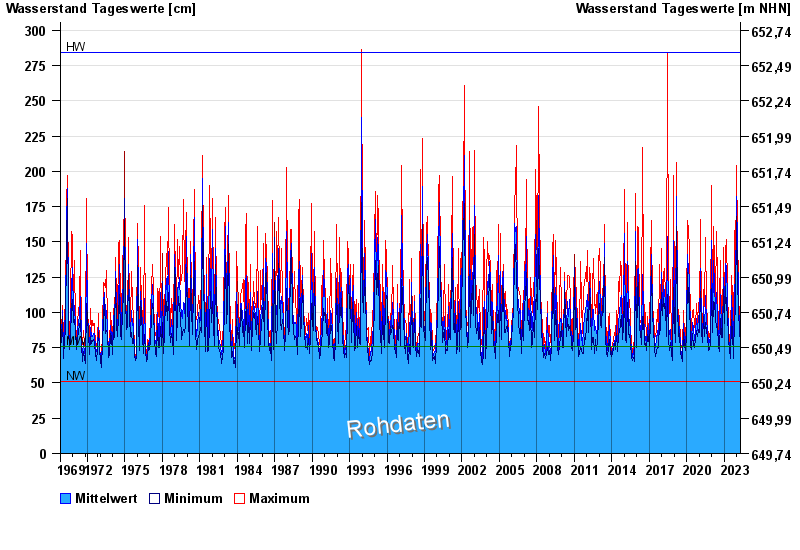
- Chart of total period

Chart of total period Linden / Sausswasser
Waterlevel from 01.11.1969 to 25.04.2024
| Date | Mean value [cm] | Maximum [cm] | Minimum [cm] |
|---|---|---|---|
| 25.04.2024 | 78 | 79 | 76 |
| 24.04.2024 | 78 | 78 | 77 |
| 23.04.2024 | 78 | 79 | 78 |
| 22.04.2024 | 80 | 82 | 79 |
| 21.04.2024 | 84 | 90 | 82 |
| 20.04.2024 | 89 | 93 | 87 |
| 19.04.2024 | 81 | 88 | 78 |
© Bayerisches Landesamt für Umwelt 2024