
- Start >
- Rivers >
- Waterlevel >
- Untere Donau >
- Leming >
- Chart of total period

Chart of total period Leming / Freybach
Waterlevel from 01.11.1974 to 19.04.2024
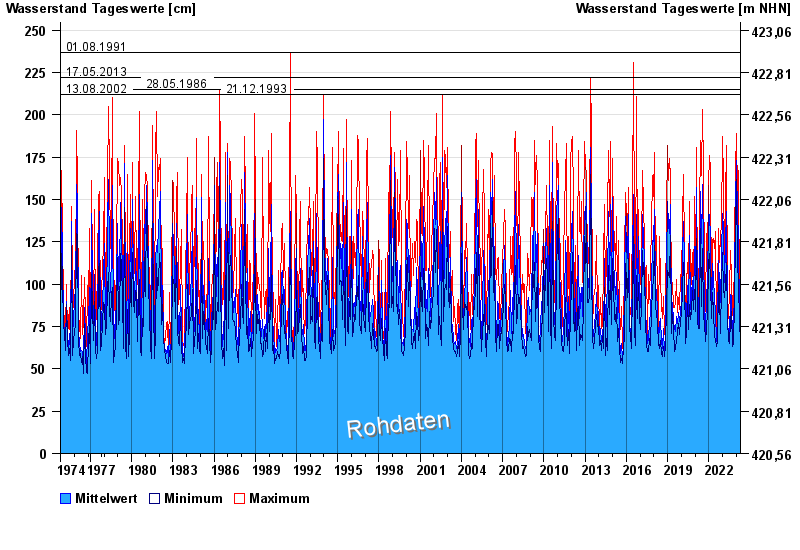
- 01.08.1991 Wasserstand: 237 cm
- 17.05.2013 Wasserstand: 222 cm
- 28.05.1986 Wasserstand: 215 cm
- 13.08.2002 Wasserstand: 212 cm
- 21.12.1993 Wasserstand: 212 cm
| Date | Mean value [cm] | Maximum [cm] | Minimum [cm] |
|---|---|---|---|
| 19.04.2024 | 94 | 137 | 81 |
| 18.04.2024 | 101 | 117 | 89 |
| 17.04.2024 | 78 | 88 | 71 |
| 16.04.2024 | 71 | 85 | 66 |
| 15.04.2024 | 68 | 75 | 63 |
| 14.04.2024 | 65 | 66 | 64 |
| 13.04.2024 | 65 | 71 | 61 |
© Bayerisches Landesamt für Umwelt 2024