
- Start >
- Rivers >
- Waterlevel >
- Untere Donau >
- Kollbach >
- Chart of total period

Chart of total period Kollbach / Kollbach
Waterlevel from 01.11.1963 to 25.04.2024
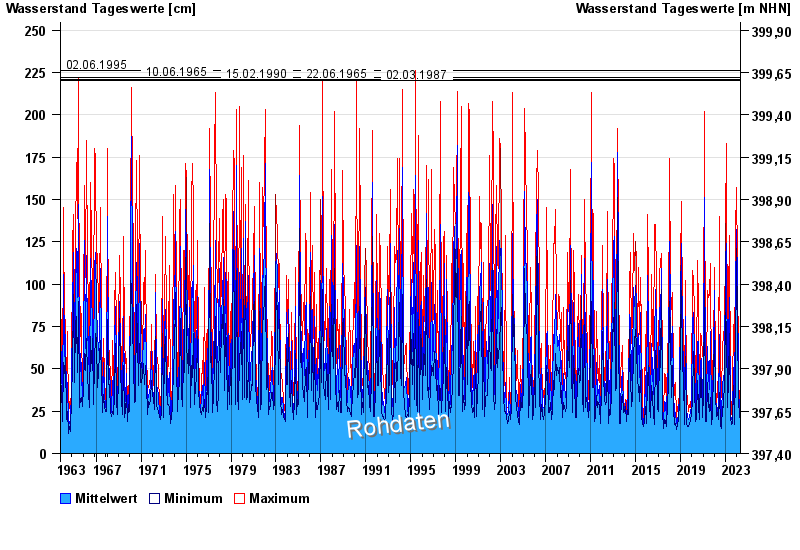
- 02.06.1995 Wasserstand: 226 cm
- 10.06.1965 Wasserstand: 222 cm
- 15.02.1990 Wasserstand: 221 cm
- 22.06.1965 Wasserstand: 221 cm
- 02.03.1987 Wasserstand: 220 cm
| Date | Mean value [cm] | Maximum [cm] | Minimum [cm] |
|---|---|---|---|
| 25.04.2024 | 19 | 19 | 18 |
| 24.04.2024 | 19 | 20 | 19 |
| 23.04.2024 | 20 | 20 | 19 |
| 22.04.2024 | 23 | 24 | 20 |
| 21.04.2024 | 20 | 25 | 18 |
| 20.04.2024 | 21 | 22 | 19 |
| 19.04.2024 | 19 | 21 | 18 |
© Bayerisches Landesamt für Umwelt 2024