
- Start >
- Rivers >
- Waterlevel >
- Untere Donau >
- Hörmannsberg >
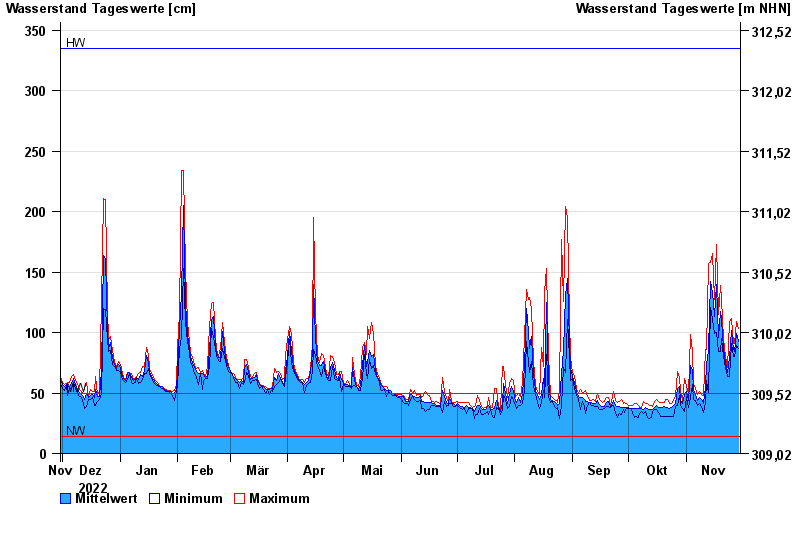
- Chart of year

Chart of year Hörmannsberg / Gaißa
Waterlevel from 30.11.2022 to 29.11.2023
| Date | Mean value [cm] | Maximum [cm] | Minimum [cm] |
|---|---|---|---|
| 29.11.2023 | 93 | 103 | 87 |
| 28.11.2023 | 99 | 109 | 89 |
| 27.11.2023 | 84 | 91 | 80 |
| 26.11.2023 | 86 | 91 | 80 |
| 25.11.2023 | 102 | 112 | 91 |
| 24.11.2023 | 79 | 109 | 64 |
| 23.11.2023 | 67 | 71 | 64 |
© Bayerisches Landesamt für Umwelt 2024