
- Start >
- Rivers >
- Waterlevel >
- Untere Donau >
- Hörmannsberg >
- Chart of year

Chart of year Hörmannsberg / Gaißa
Waterlevel from 01.01.2024 to 19.04.2024
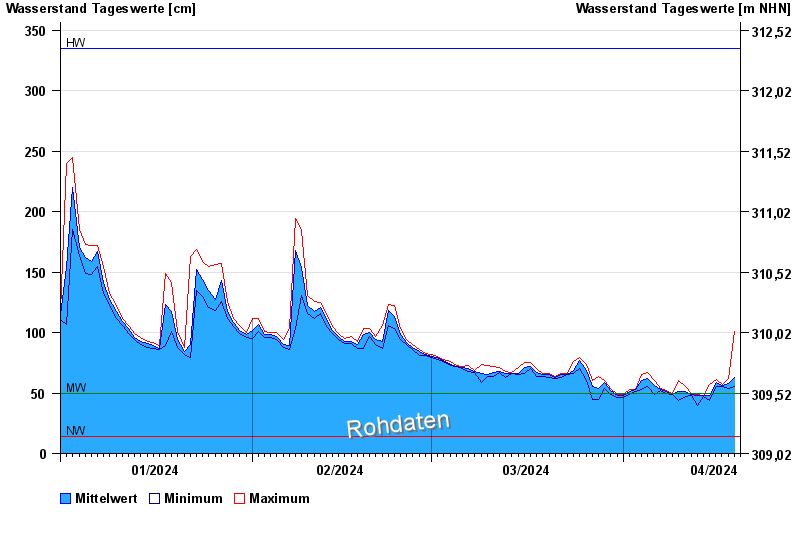
| Date | Mean value [cm] | Maximum [cm] | Minimum [cm] |
|---|---|---|---|
| 19.04.2024 | 59 | 62 | 53 |
| 18.04.2024 | 58 | 62 | 54 |
| 17.04.2024 | 56 | 57 | 55 |
| 16.04.2024 | 59 | 61 | 55 |
| 15.04.2024 | 48 | 57 | 44 |
| 14.04.2024 | 48 | 48 | 47 |
| 13.04.2024 | 48 | 49 | 40 |
© Bayerisches Landesamt für Umwelt 2024