
- Start >
- Rivers >
- Waterlevel >
- Untere Donau >
- Hörmannsberg >
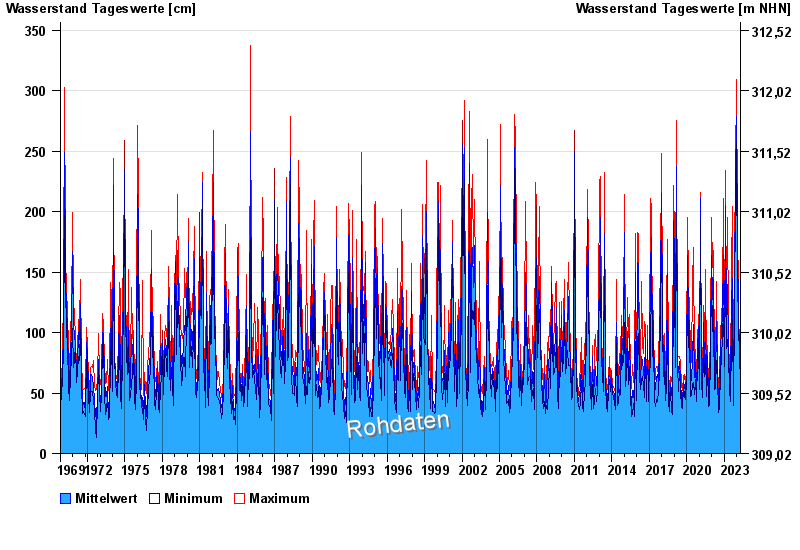
- Chart of total period

Chart of total period Hörmannsberg / Gaißa
Waterlevel from 01.11.1969 to 23.04.2024
| Date | Mean value [cm] | Maximum [cm] | Minimum [cm] |
|---|---|---|---|
| 23.04.2024 | 68 | 72 | 64 |
| 22.04.2024 | 81 | 89 | 73 |
| 21.04.2024 | 90 | 105 | 82 |
| 20.04.2024 | 112 | 118 | 103 |
| 19.04.2024 | 63 | 101 | 55 |
| 18.04.2024 | 58 | 62 | 54 |
| 17.04.2024 | 56 | 57 | 55 |
© Bayerisches Landesamt für Umwelt 2024