
- Start >
- Rivers >
- Waterlevel >
- Untere Donau >
- Hörmannsberg >
- Chart of total period

Chart of total period Hörmannsberg / Gaißa
Waterlevel from 01.11.1969 to 19.04.2024
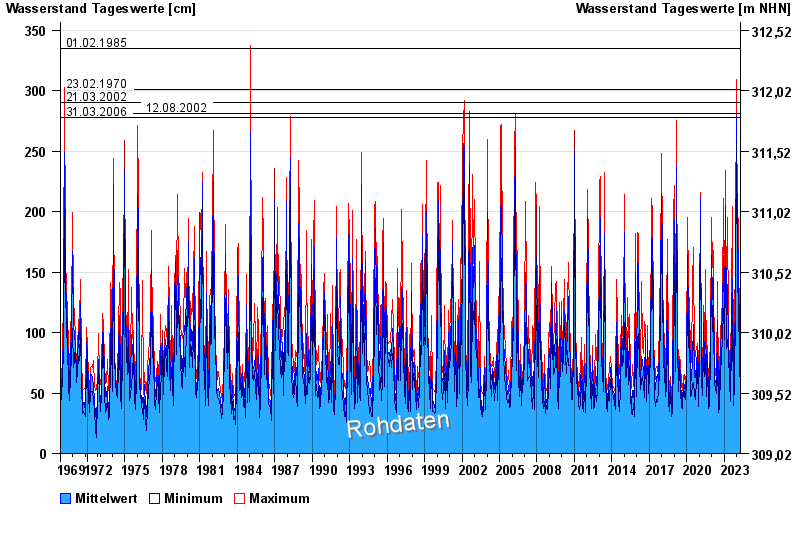
- 01.02.1985 Wasserstand: 335 cm
- 23.02.1970 Wasserstand: 301 cm
- 21.03.2002 Wasserstand: 290 cm
- 12.08.2002 Wasserstand: 281 cm
- 31.03.2006 Wasserstand: 278 cm
| Date | Mean value [cm] | Maximum [cm] | Minimum [cm] |
|---|---|---|---|
| 19.04.2024 | 59 | 62 | 53 |
| 18.04.2024 | 58 | 62 | 54 |
| 17.04.2024 | 56 | 57 | 55 |
| 16.04.2024 | 59 | 61 | 55 |
| 15.04.2024 | 48 | 57 | 44 |
| 14.04.2024 | 48 | 48 | 47 |
| 13.04.2024 | 48 | 49 | 40 |
© Bayerisches Landesamt für Umwelt 2024