
- Start >
- Rivers >
- Waterlevel >
- Untere Donau >
- Harburg >
- Chart of total period

Chart of total period Harburg / Wörnitz
Waterlevel from 22.03.1930 to 18.04.2024
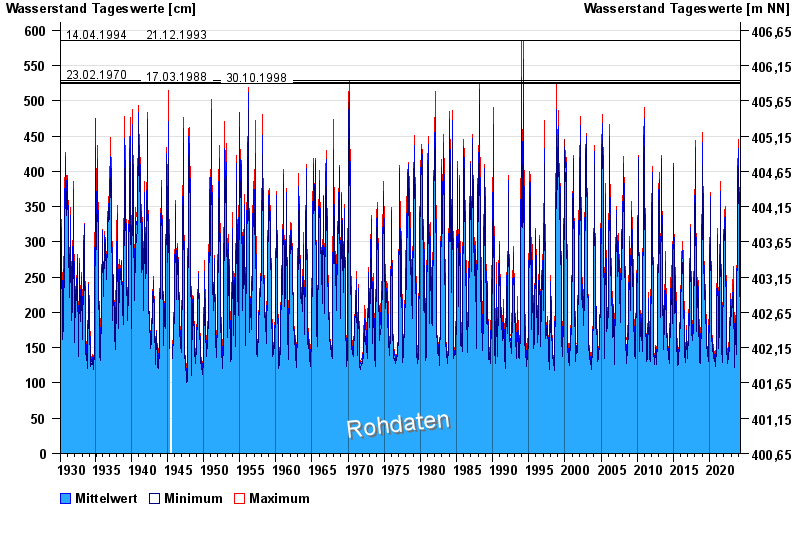
- 14.04.1994 Wasserstand: 586 cm
- 21.12.1993 Wasserstand: 585 cm
- 23.02.1970 Wasserstand: 528 cm
- 17.03.1988 Wasserstand: 526 cm
- 30.10.1998 Wasserstand: 524 cm
| Date | Mean value [cm] | Maximum [cm] | Minimum [cm] |
|---|---|---|---|
| 18.04.2024 | 139 | 141 | 138 |
| 17.04.2024 | 138 | 145 | 126 |
| 16.04.2024 | 125 | 128 | 122 |
| 15.04.2024 | 124 | 126 | 122 |
| 14.04.2024 | 128 | 132 | 123 |
| 13.04.2024 | 123 | 125 | 120 |
| 12.04.2024 | 124 | 127 | 121 |
© Bayerisches Landesamt für Umwelt 2024