
- Start >
- Rivers >
- Waterlevel >
- Untere Donau >
- Hammermühle >
- Chart of total period

Chart of total period Hammermühle / Otterbach
Waterlevel from 01.11.1969 to 23.04.2024
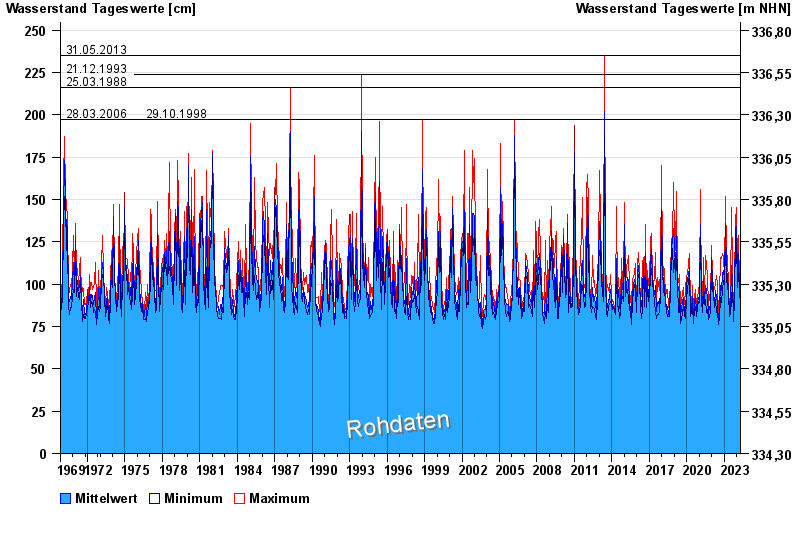
- 31.05.2013 Wasserstand: 235 cm
- 21.12.1993 Wasserstand: 224 cm
- 25.03.1988 Wasserstand: 216 cm
- 28.03.2006 Wasserstand: 197 cm
- 29.10.1998 Wasserstand: 197 cm
| Date | Mean value [cm] | Maximum [cm] | Minimum [cm] |
|---|---|---|---|
| 23.04.2024 | 92 | 93 | 91 |
| 22.04.2024 | 98 | 106 | 93 |
| 21.04.2024 | 99 | 111 | 92 |
| 20.04.2024 | 93 | 95 | 89 |
| 19.04.2024 | 88 | 89 | 86 |
| 18.04.2024 | 88 | 91 | 82 |
| 17.04.2024 | 87 | 88 | 86 |
© Bayerisches Landesamt für Umwelt 2024