
- Start >
- Rivers >
- Waterlevel >
- Untere Donau >
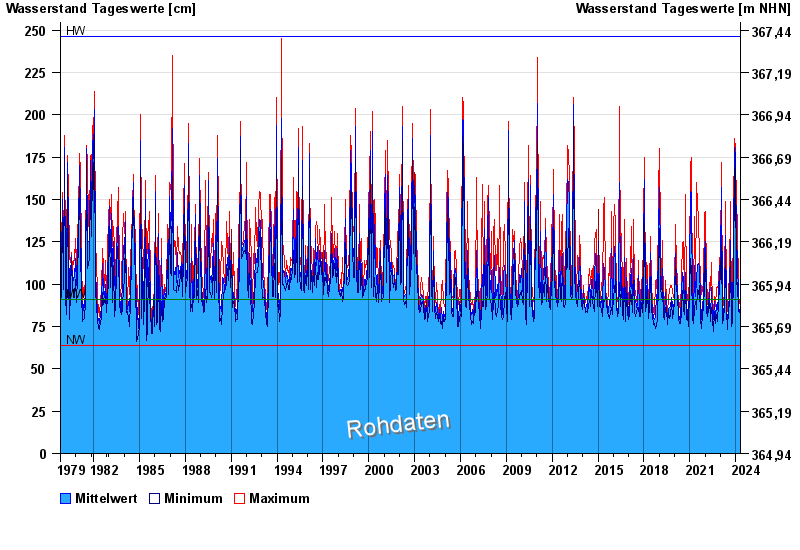
- Grafentraubach >
- Chart of total period

Chart of total period Grafentraubach / Kleine Laber
Waterlevel from 01.11.1979 to 25.04.2024
Pegel
Nahegelegene Bauarbeiten können zu Beeinflussungen des Wasserstands führen.
| Date | Mean value [cm] | Maximum [cm] | Minimum [cm] |
|---|---|---|---|
| 25.04.2024 | 78 | 78 | 78 |
| 24.04.2024 | 78 | 79 | 78 |
| 23.04.2024 | 80 | 81 | 79 |
| 22.04.2024 | 82 | 84 | 81 |
| 21.04.2024 | 83 | 86 | 82 |
| 20.04.2024 | 83 | 86 | 80 |
| 19.04.2024 | 82 | 84 | 79 |
© Bayerisches Landesamt für Umwelt 2024