
- Start >
- Rivers >
- Waterlevel >
- Untere Donau >
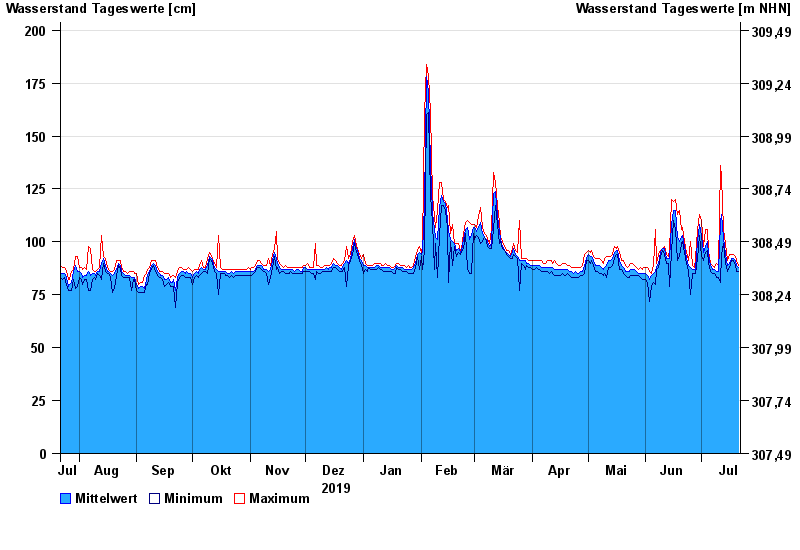
- Grafenmühle >
- Chart of year

Chart of year Grafenmühle / Vils
Waterlevel from 22.07.2019 to 21.07.2020
- 23.02.1970 Wasserstand: 537 cm
- 14.01.2011 Wasserstand: 496 cm
- 03.06.2013 Wasserstand: 462 cm
- 14.01.2004 Wasserstand: 439 cm
- 03.08.1991 Wasserstand: 435 cm
| Date | Mean value [cm] | Maximum [cm] | Minimum [cm] |
|---|---|---|---|
| 21.07.2020 | 88 | 89 | 86 |
| 20.07.2020 | 89 | 91 | 86 |
| 19.07.2020 | 91 | 93 | 89 |
| 18.07.2020 | 92 | 94 | 91 |
| 17.07.2020 | 92 | 94 | 91 |
| 16.07.2020 | 90 | 94 | 88 |
| 15.07.2020 | 89 | 91 | 86 |
© Bayerisches Landesamt für Umwelt 2024