
- Start >
- Rivers >
- Waterlevel >
- Untere Donau >
- Grafenmühle >
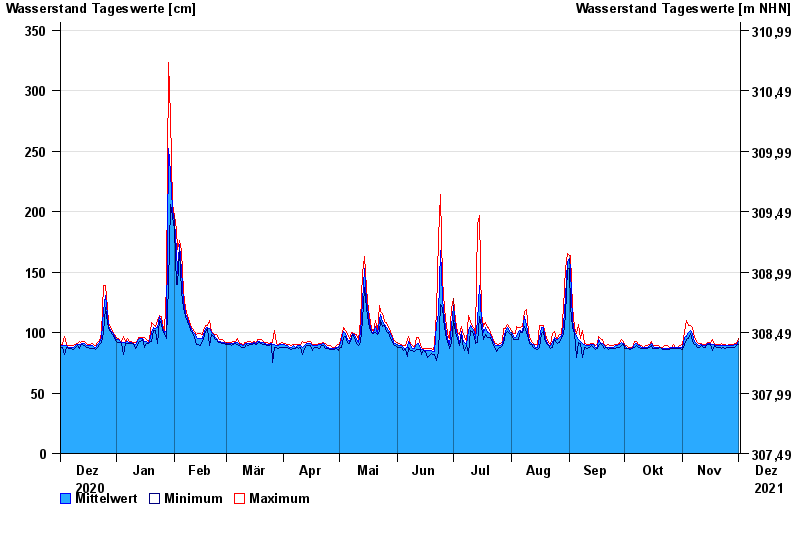
- Chart of year

Chart of year Grafenmühle / Vils
Waterlevel from 02.12.2020 to 01.12.2021
- 23.02.1970 Wasserstand: 537 cm
- 14.01.2011 Wasserstand: 496 cm
- 03.06.2013 Wasserstand: 462 cm
- 14.01.2004 Wasserstand: 439 cm
- 03.08.1991 Wasserstand: 435 cm
| Date | Mean value [cm] | Maximum [cm] | Minimum [cm] |
|---|---|---|---|
| 01.12.2021 | 93 | 95 | 90 |
| 30.11.2021 | 90 | 91 | 89 |
| 29.11.2021 | 90 | 91 | 88 |
| 28.11.2021 | 89 | 90 | 88 |
| 27.11.2021 | 89 | 90 | 88 |
| 26.11.2021 | 89 | 90 | 88 |
| 25.11.2021 | 89 | 89 | 88 |
© Bayerisches Landesamt für Umwelt 2024