
- Start >
- Rivers >
- Waterlevel >
- Untere Donau >
- Grafenau >
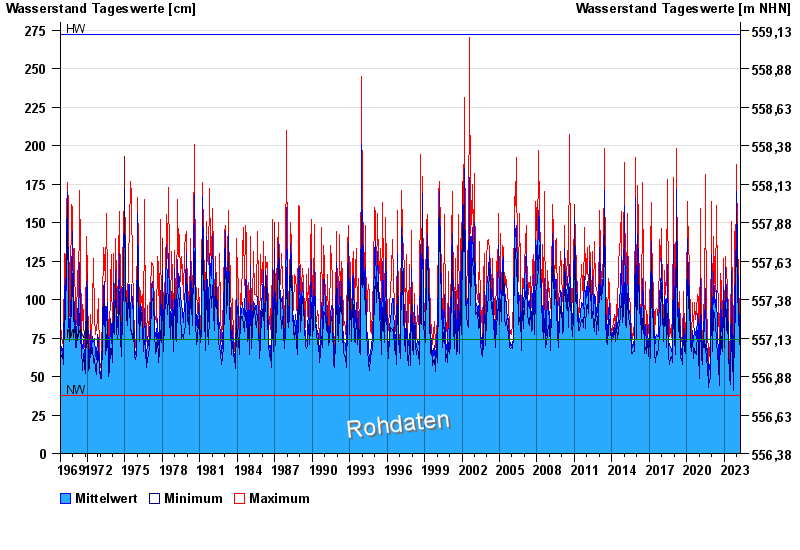
- Chart of total period

Chart of total period Grafenau / Kleine Ohe
Waterlevel from 01.11.1969 to 23.04.2024
| Date | Mean value [cm] | Maximum [cm] | Minimum [cm] |
|---|---|---|---|
| 23.04.2024 | 63 | 64 | 63 |
| 22.04.2024 | 66 | 68 | 64 |
| 21.04.2024 | 73 | 81 | 69 |
| 20.04.2024 | 83 | 89 | 79 |
| 19.04.2024 | 68 | 82 | 49 |
| 18.04.2024 | 68 | 81 | 52 |
| 17.04.2024 | 63 | 69 | 61 |
© Bayerisches Landesamt für Umwelt 2024