
- Start >
- Rivers >
- Waterlevel >
- Untere Donau >
- Gogl-Mühle >
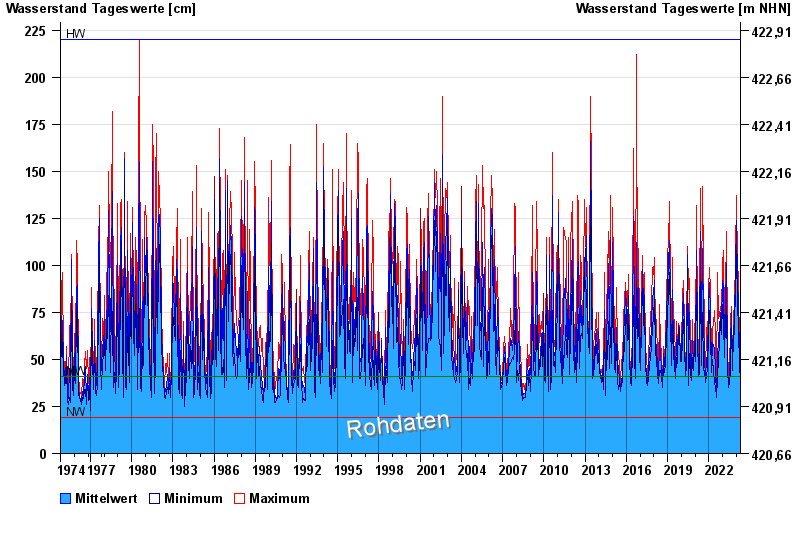
- Chart of total period

Chart of total period Gogl-Mühle / Chamb
Waterlevel from 01.11.1974 to 19.04.2024
| Date | Mean value [cm] | Maximum [cm] | Minimum [cm] |
|---|---|---|---|
| 19.04.2024 | 57 | 65 | 53 |
| 18.04.2024 | 65 | 73 | 60 |
| 17.04.2024 | 47 | 60 | 44 |
| 16.04.2024 | 42 | 44 | 40 |
| 15.04.2024 | 40 | 41 | 38 |
| 14.04.2024 | 39 | 39 | 38 |
| 13.04.2024 | 39 | 40 | 38 |
© Bayerisches Landesamt für Umwelt 2024