
- Start >
- Rivers >
- Waterlevel >
- Untere Donau >
- Eberhardsreuth >
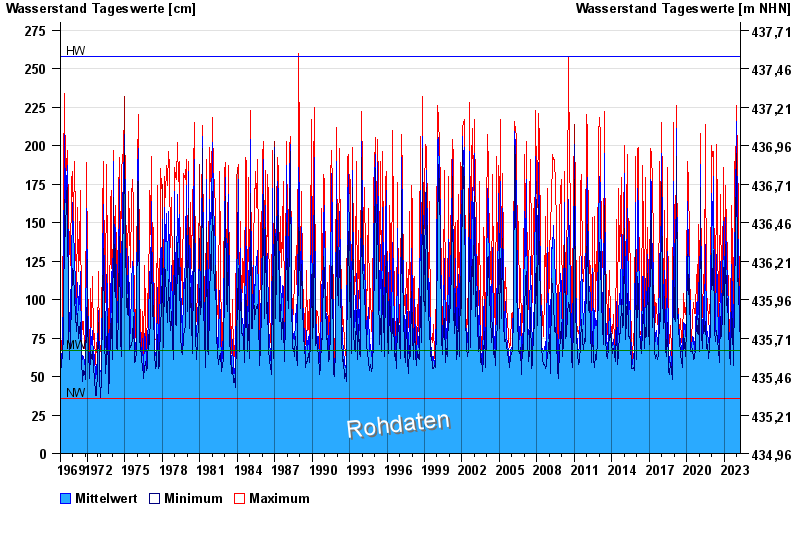
- Chart of total period

Chart of total period Eberhardsreuth / Mitternacher Ohe
Waterlevel from 01.11.1969 to 25.04.2024
| Date | Mean value [cm] | Maximum [cm] | Minimum [cm] |
|---|---|---|---|
| 25.04.2024 | 79 | 82 | 79 |
| 24.04.2024 | 80 | 81 | 79 |
| 23.04.2024 | 83 | 85 | 81 |
| 22.04.2024 | 88 | 94 | 85 |
| 21.04.2024 | 94 | 103 | 90 |
| 20.04.2024 | 123 | 145 | 104 |
| 19.04.2024 | 90 | 146 | 76 |
© Bayerisches Landesamt für Umwelt 2024