
- Start >
- Rivers >
- Waterlevel >
- Untere Donau >
- Eberhardsreuth >
- Chart of total period

Chart of total period Eberhardsreuth / Mitternacher Ohe
Waterlevel from 01.11.1969 to 19.04.2024
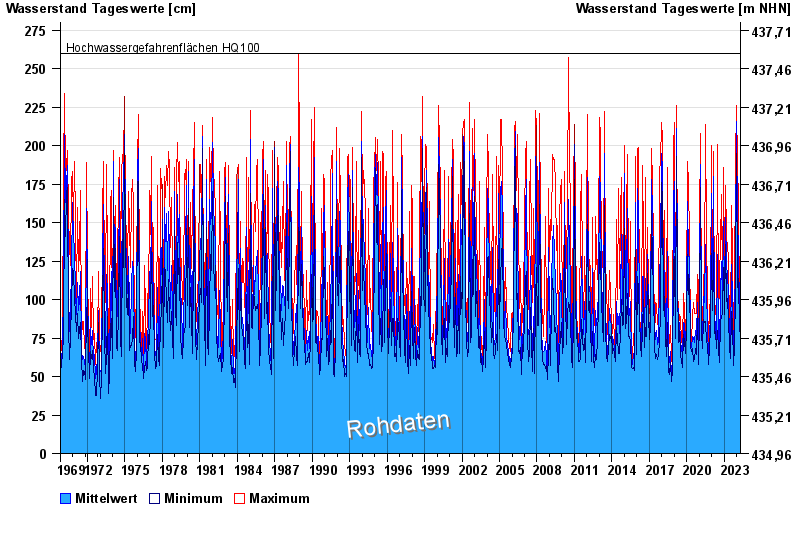
- Hochwassergefahrenfläche HQ100 260 cm
| Date | Mean value [cm] | Maximum [cm] | Minimum [cm] |
|---|---|---|---|
| 19.04.2024 | 88 | 145 | 76 |
| 18.04.2024 | 81 | 85 | 78 |
| 17.04.2024 | 77 | 79 | 75 |
| 16.04.2024 | 74 | 78 | 73 |
| 15.04.2024 | 71 | 79 | 68 |
| 14.04.2024 | 69 | 71 | 67 |
| 13.04.2024 | 69 | 70 | 68 |
© Bayerisches Landesamt für Umwelt 2024