
- Start >
- Rivers >
- Waterlevel >
- Untere Donau >
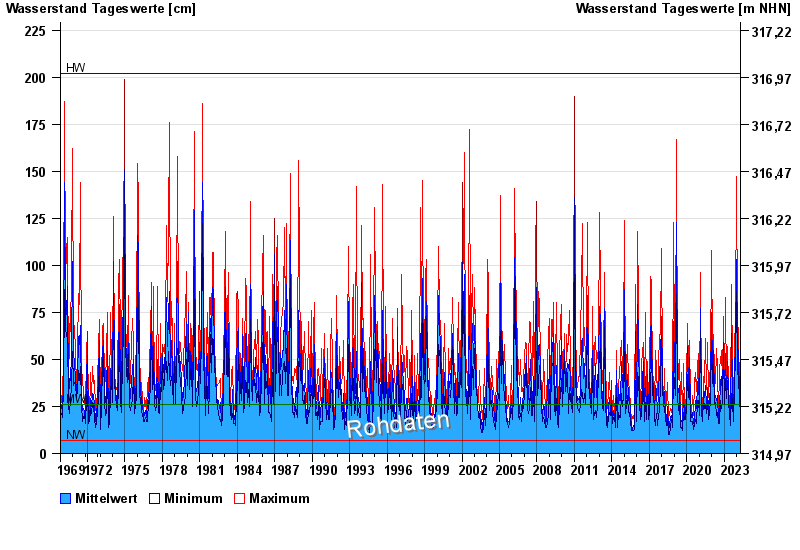
- Deggendorf >
- Chart of total period

Chart of total period Deggendorf / Kollbach
Waterlevel from 01.11.1969 to 23.04.2024
| Date | Mean value [cm] | Maximum [cm] | Minimum [cm] |
|---|---|---|---|
| 23.04.2024 | 27 | 28 | 26 |
| 22.04.2024 | 30 | 36 | 28 |
| 21.04.2024 | 34 | 39 | 31 |
| 20.04.2024 | 49 | 55 | 37 |
| 19.04.2024 | 27 | 53 | 21 |
| 18.04.2024 | 22 | 23 | 21 |
| 17.04.2024 | 23 | 25 | 22 |
© Bayerisches Landesamt für Umwelt 2024