
- Start >
- Rivers >
- Waterlevel >
- Untere Donau >
- Cham >
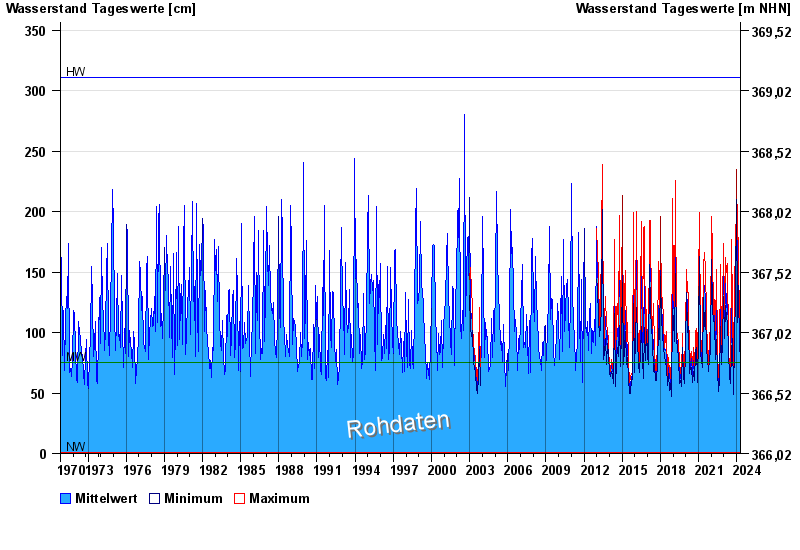
- Chart of total period

Chart of total period Cham / Regen
Waterlevel from 01.11.1970 to 19.04.2024
| Date | Mean value [cm] | Maximum [cm] | Minimum [cm] |
|---|---|---|---|
| 19.04.2024 | 89 | 92 | 86 |
| 18.04.2024 | 88 | 93 | 82 |
| 17.04.2024 | 81 | 83 | 77 |
| 16.04.2024 | 71 | 77 | 66 |
| 15.04.2024 | 66 | 67 | 64 |
| 14.04.2024 | 66 | 67 | 64 |
| 13.04.2024 | 67 | 68 | 64 |
© Bayerisches Landesamt für Umwelt 2024