
- Start >
- Rivers >
- Waterlevel >
- Untere Donau >
- Bruckhäuser >
- Chart of total period

Chart of total period Bruckhäuser / Kollbach
Waterlevel from 22.04.2002 to 25.04.2024
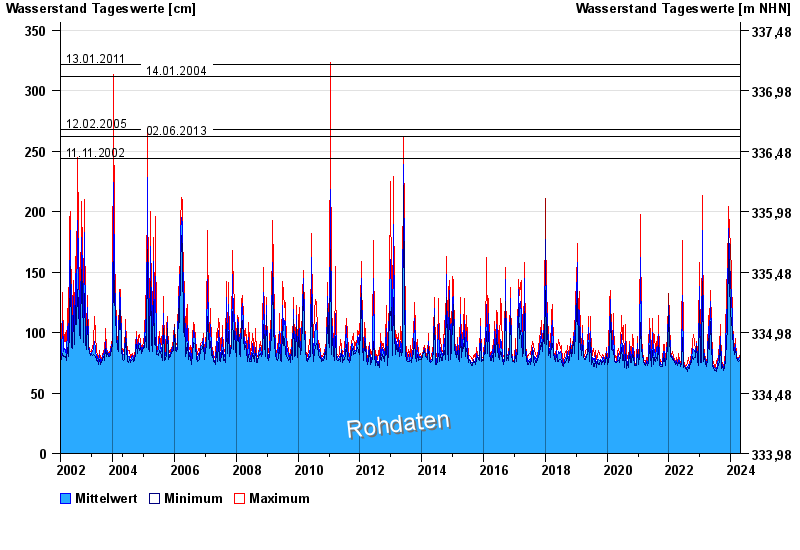
- 13.01.2011 Wasserstand: 322 cm
- 14.01.2004 Wasserstand: 312 cm
- 12.02.2005 Wasserstand: 268 cm
- 02.06.2013 Wasserstand: 262 cm
- 11.11.2002 Wasserstand: 244 cm
| Date | Mean value [cm] | Maximum [cm] | Minimum [cm] |
|---|---|---|---|
| 25.04.2024 | 77 | 77 | 76 |
| 24.04.2024 | 76 | 76 | 75 |
| 23.04.2024 | 76 | 77 | 76 |
| 22.04.2024 | 78 | 78 | 76 |
| 21.04.2024 | 77 | 78 | 76 |
| 20.04.2024 | 77 | 78 | 76 |
| 19.04.2024 | 77 | 77 | 75 |
© Bayerisches Landesamt für Umwelt 2024