
- Start >
- Rivers >
- Waterlevel >
- Untere Donau >
- Altdorf >
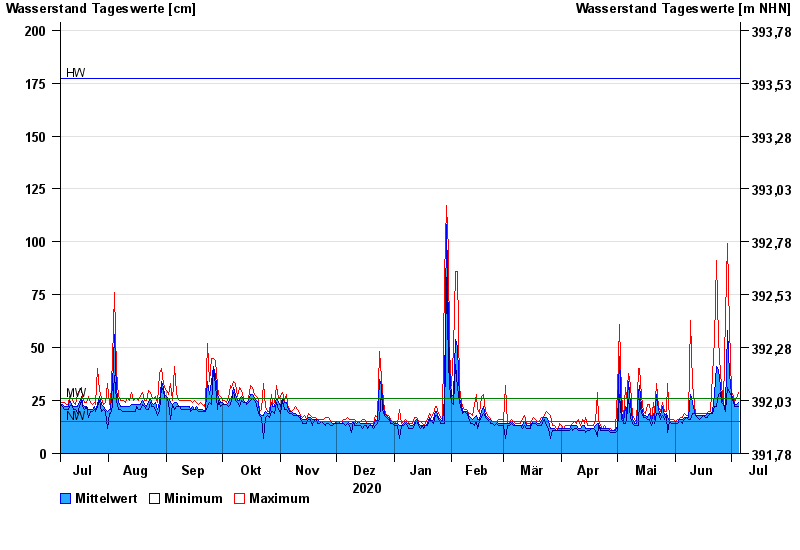
- Chart of year

Chart of year Altdorf / Pfettrach
Waterlevel from 06.07.2020 to 05.07.2021
| Date | Mean value [cm] | Maximum [cm] | Minimum [cm] |
|---|---|---|---|
| 05.07.2021 | 24 | 29 | 22 |
| 04.07.2021 | 23 | 26 | 22 |
| 03.07.2021 | 23 | 24 | 22 |
| 02.07.2021 | 25 | 27 | 24 |
| 01.07.2021 | 28 | 29 | 27 |
| 30.06.2021 | 38 | 60 | 29 |
| 29.06.2021 | 58 | 99 | 31 |
© Bayerisches Landesamt für Umwelt 2024